
Hi and welcome to MathSux! In this post, we are going to go over the rules for graphing linear inequalities on a coordinate plane when it comes to drawing lines, circles , and shading, then we are going to solve an example step by step. If you have any questions, check out the video below and try the practice questions at the end of this post! If you still have questions, don’t hesitate to comment below and happy calculating! 🙂

Graphing Linear Inequalities:
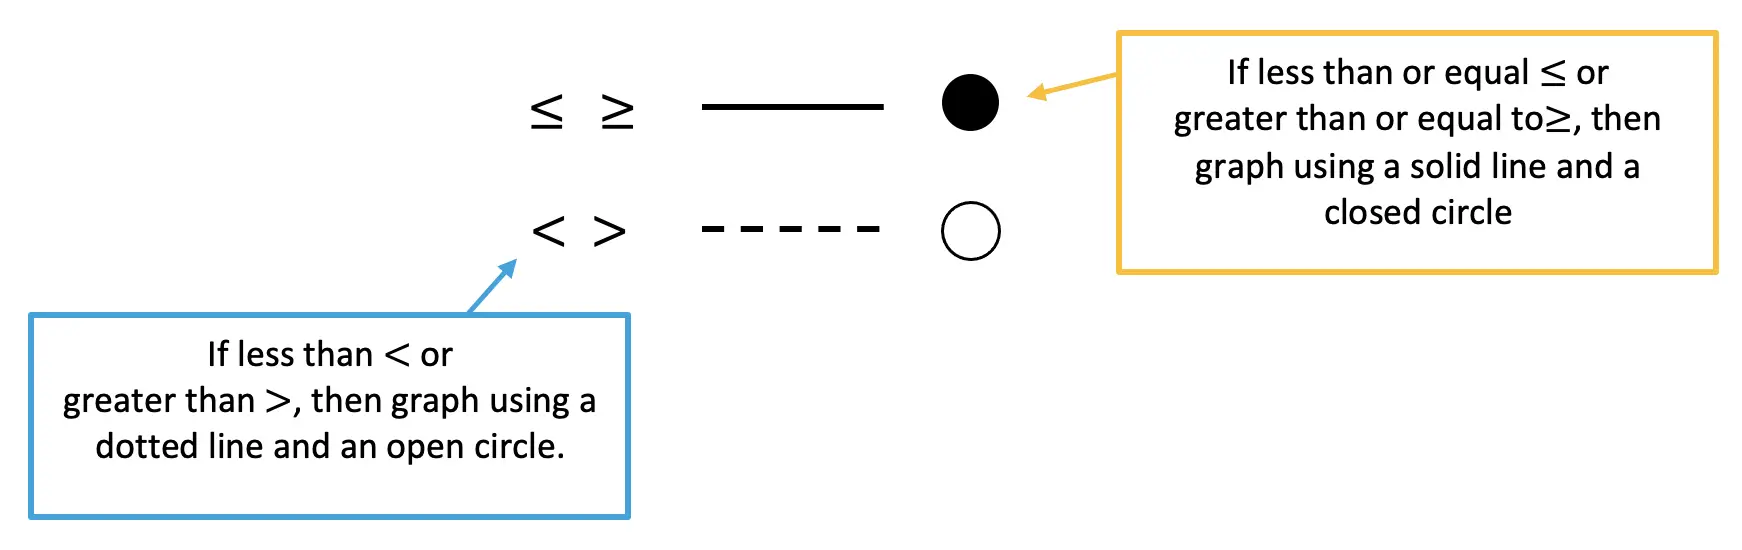
When graphing linear inequalities, we always want to treat the inequality as an equation of a line in form y=mx+b….with a few exceptions:


Now that we know the rules, of graphing inequalities, let’s take a look at an Example!
Graphing Linear Inequalities Example:


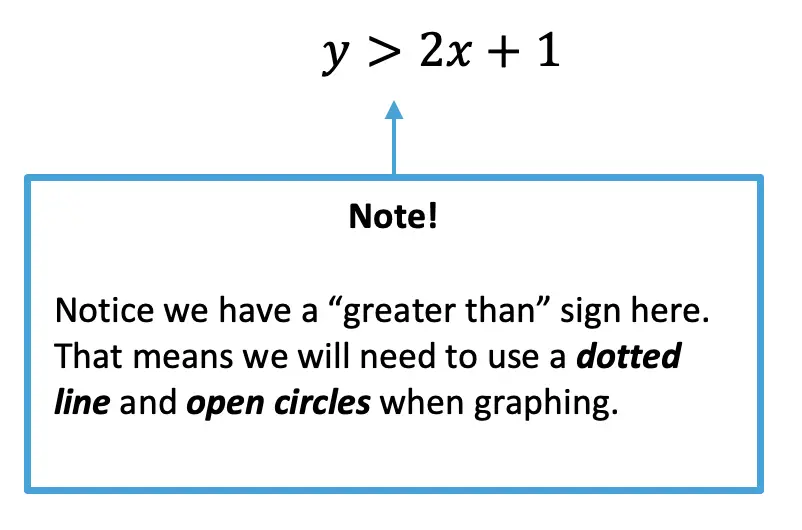
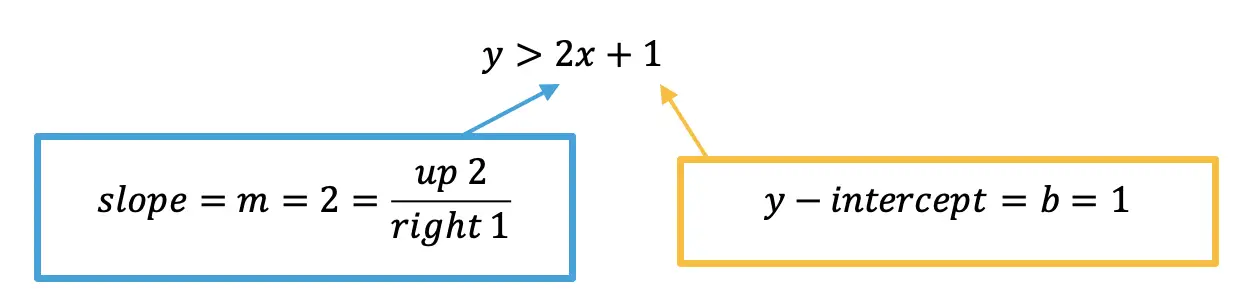
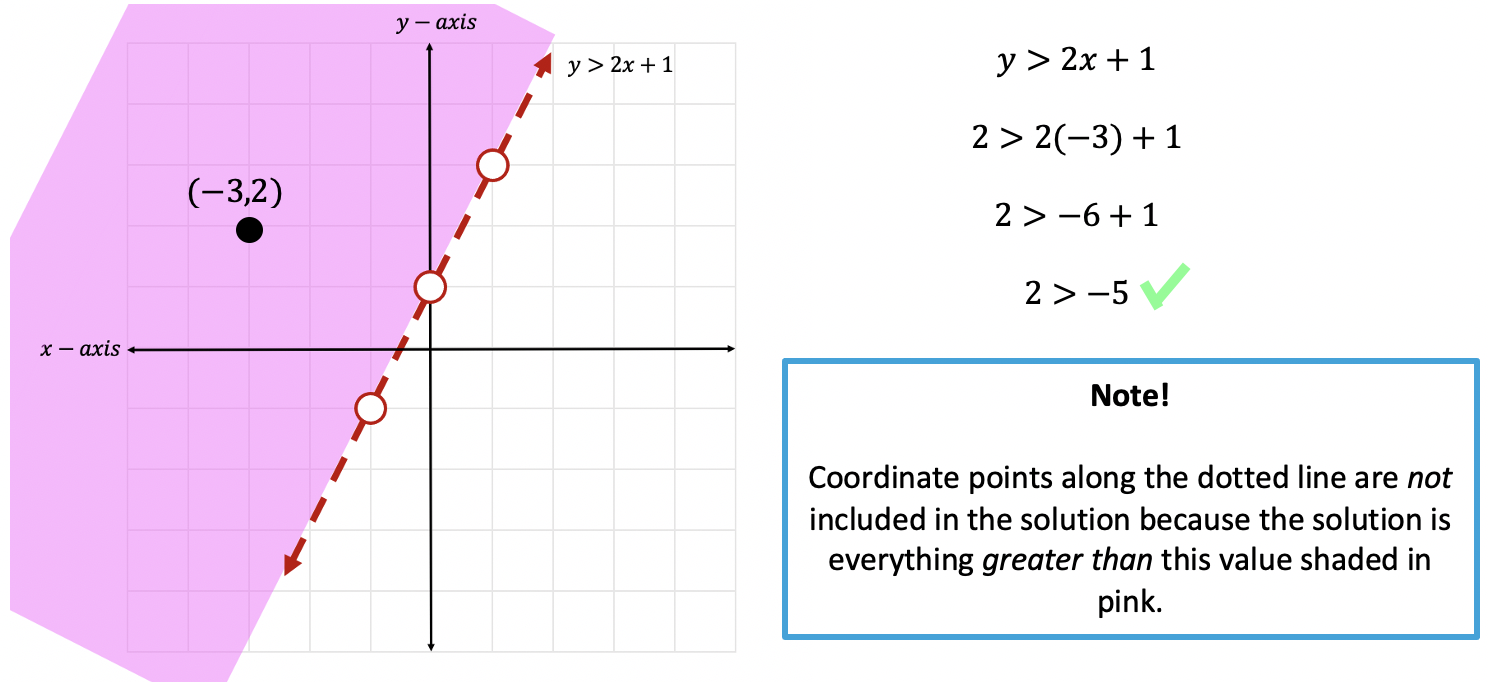
Step 1: First, let’s identify what type of inequality we have here. Since we are working with a > sign, we will need to use a dotted line and open circles when creating our graph.

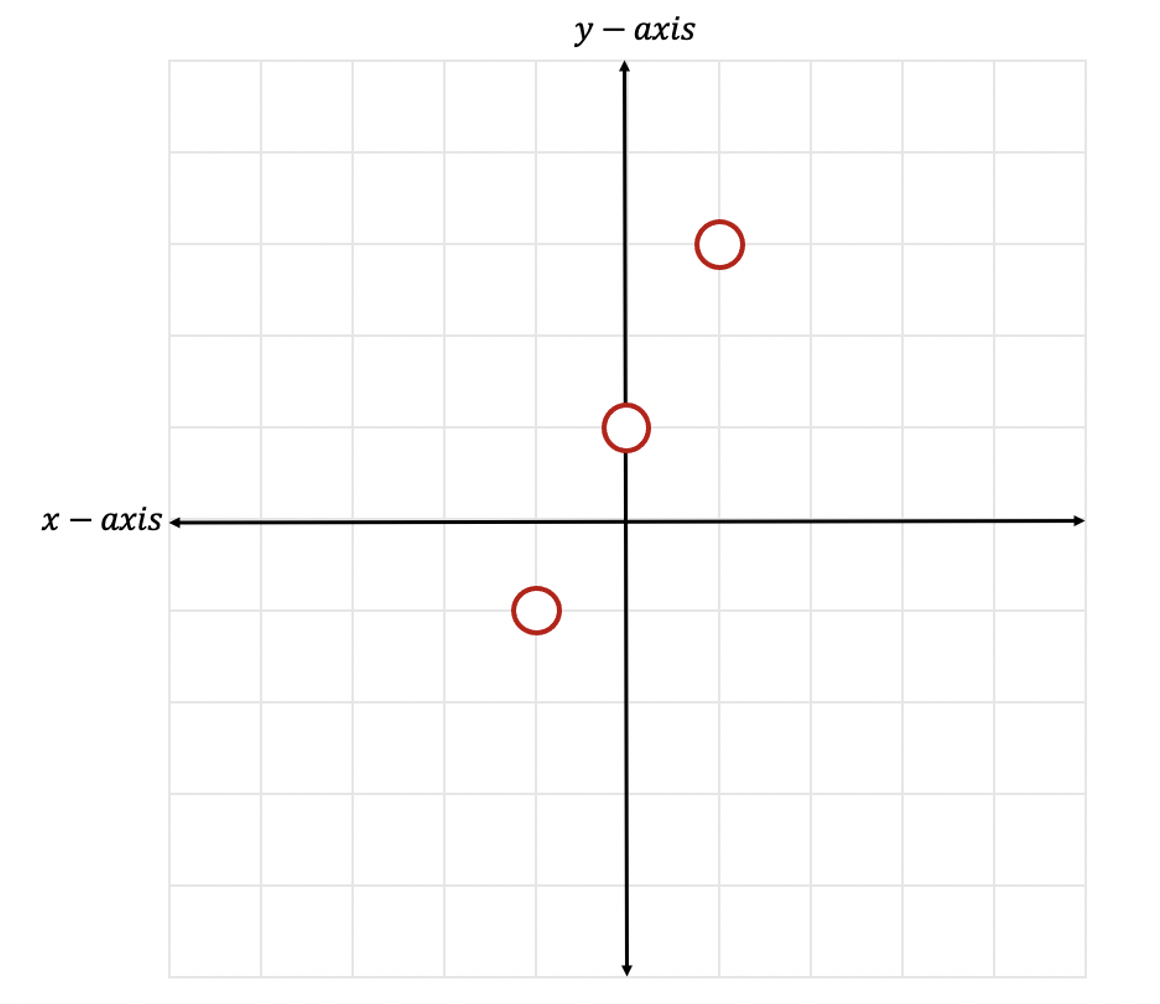
Step 2: Now we are going to start graphing our linear inequality as a normal equation of a line, by identifying the slope and the y-intercept only this time keeping open circles in mind. (For a review on how to graph regular equation of a line in y=mx+b form, click here)


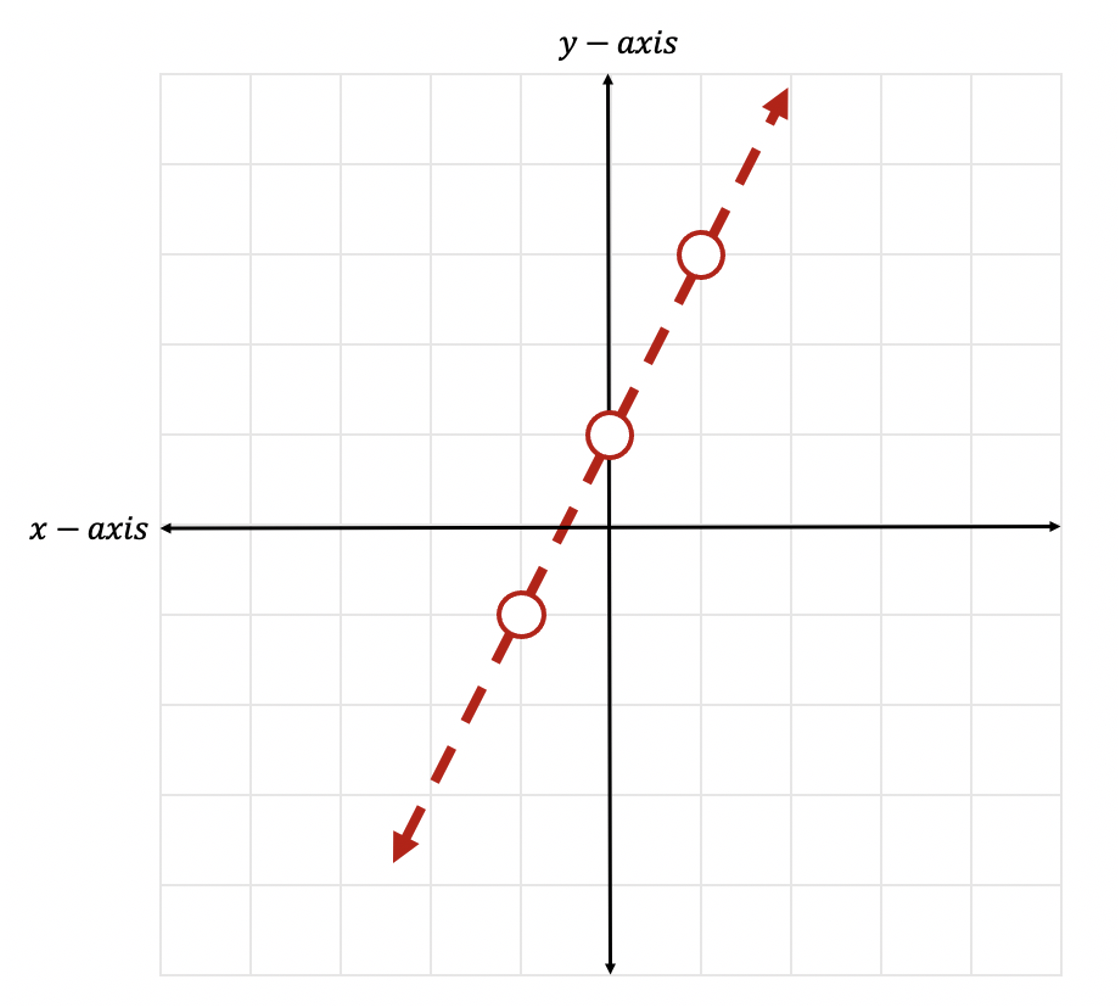
Step 3: Now let’s connect our dots, by using a dotted line to represent our greater than sign.

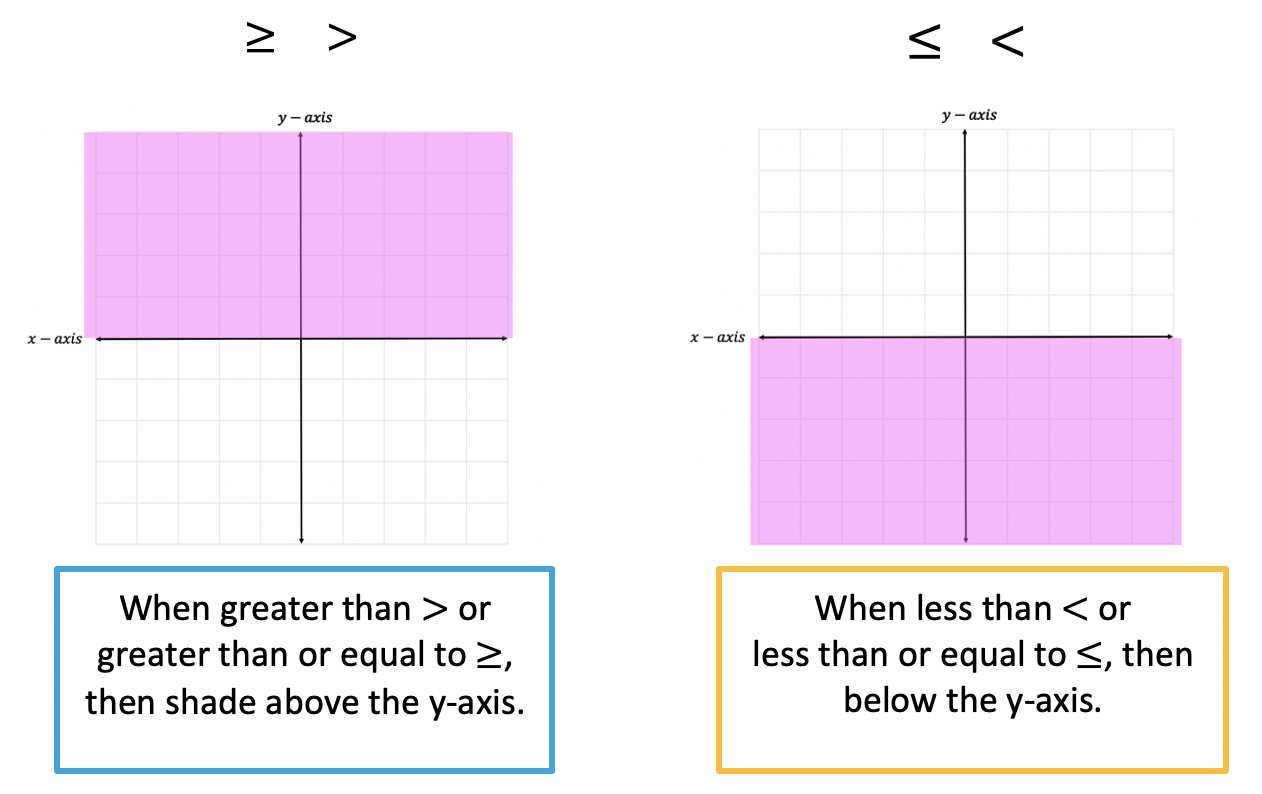
Step 4: Now it is time for us to shade our graph, since this is an inequality, we need to show all of our potential solutions with shading. Since we have a greater than sign, , we will be shading above the y-axis. Notice all the positive y-values above are included to the left of our line. This is where we will shade.

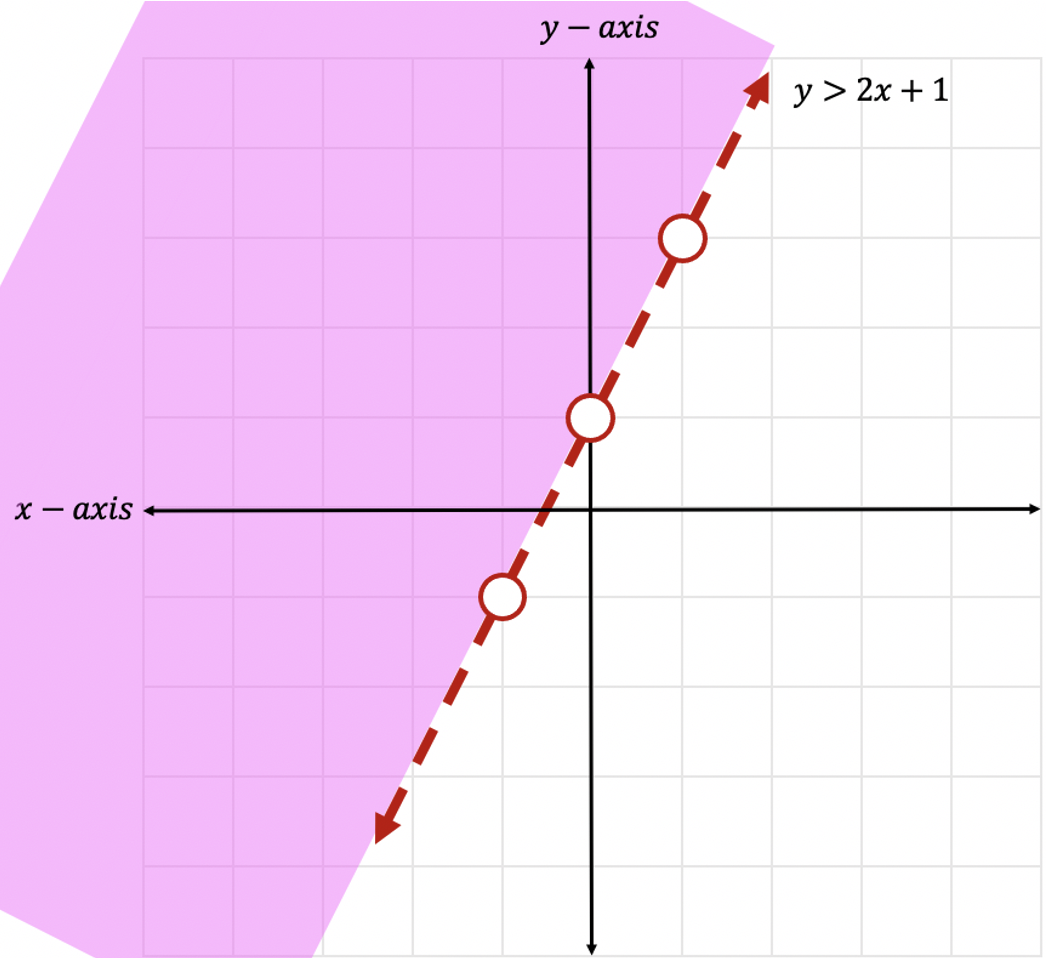
Step 5: Check! Now we need to check our work. To do that, we can choose any point within our shaded region, if the coordinate point we chose hold true when plugged into our inequality then we are correct!
Let’s take the point (-3,2) plugging it into our inequality where x=-3 and y=2.

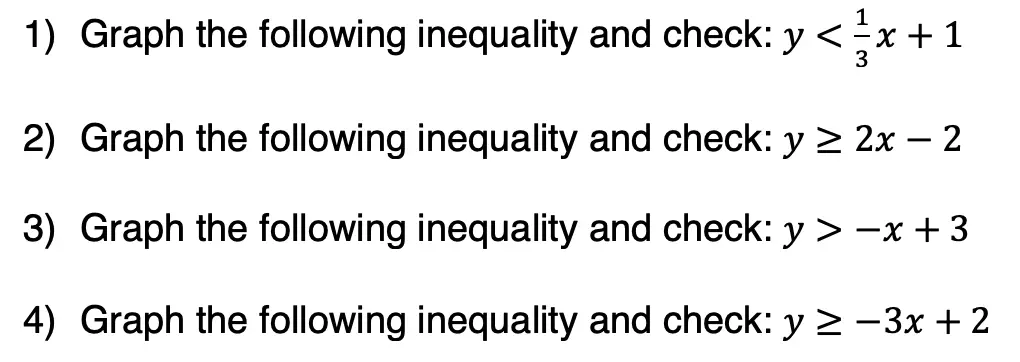
Practice Questions:

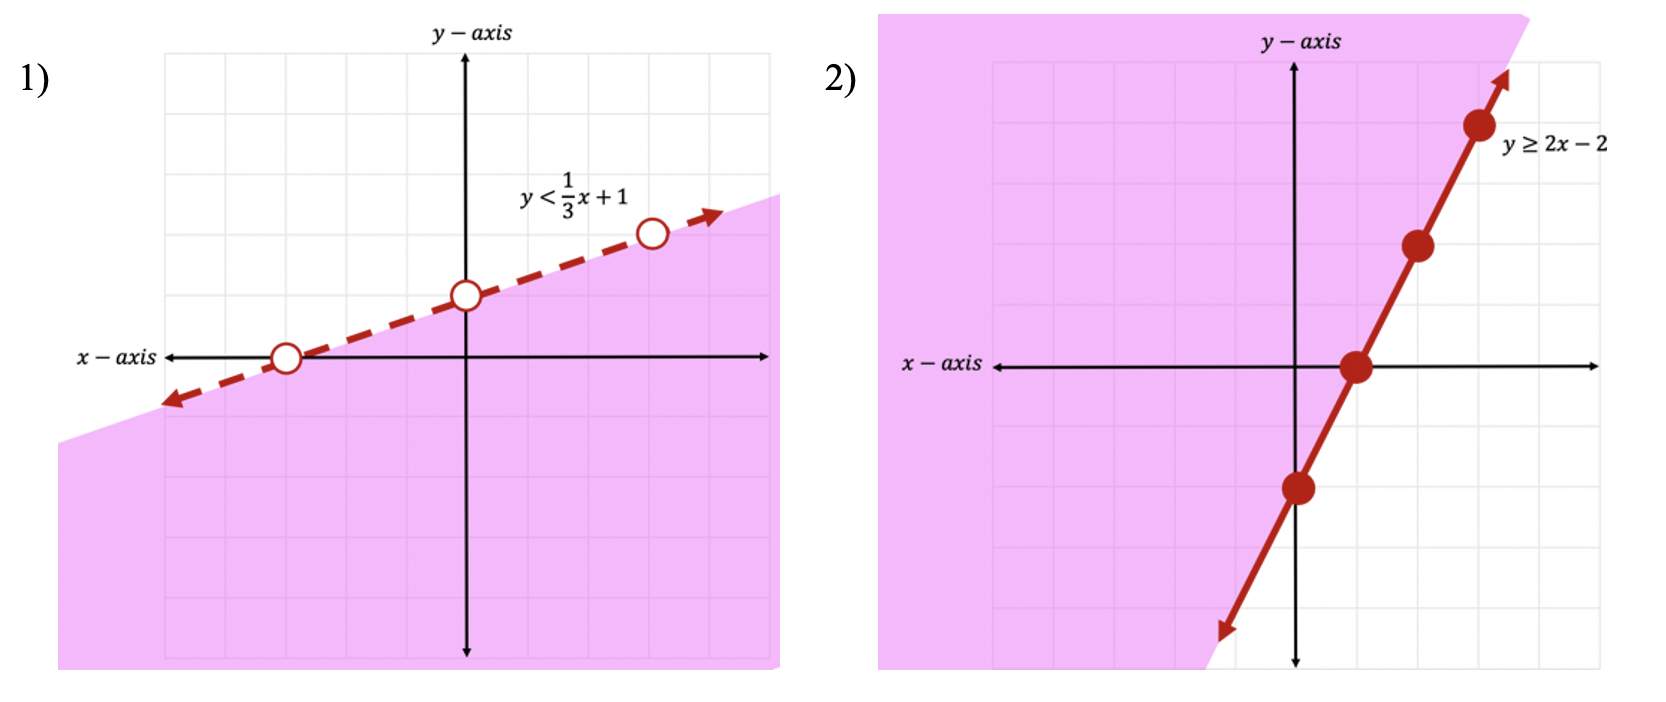
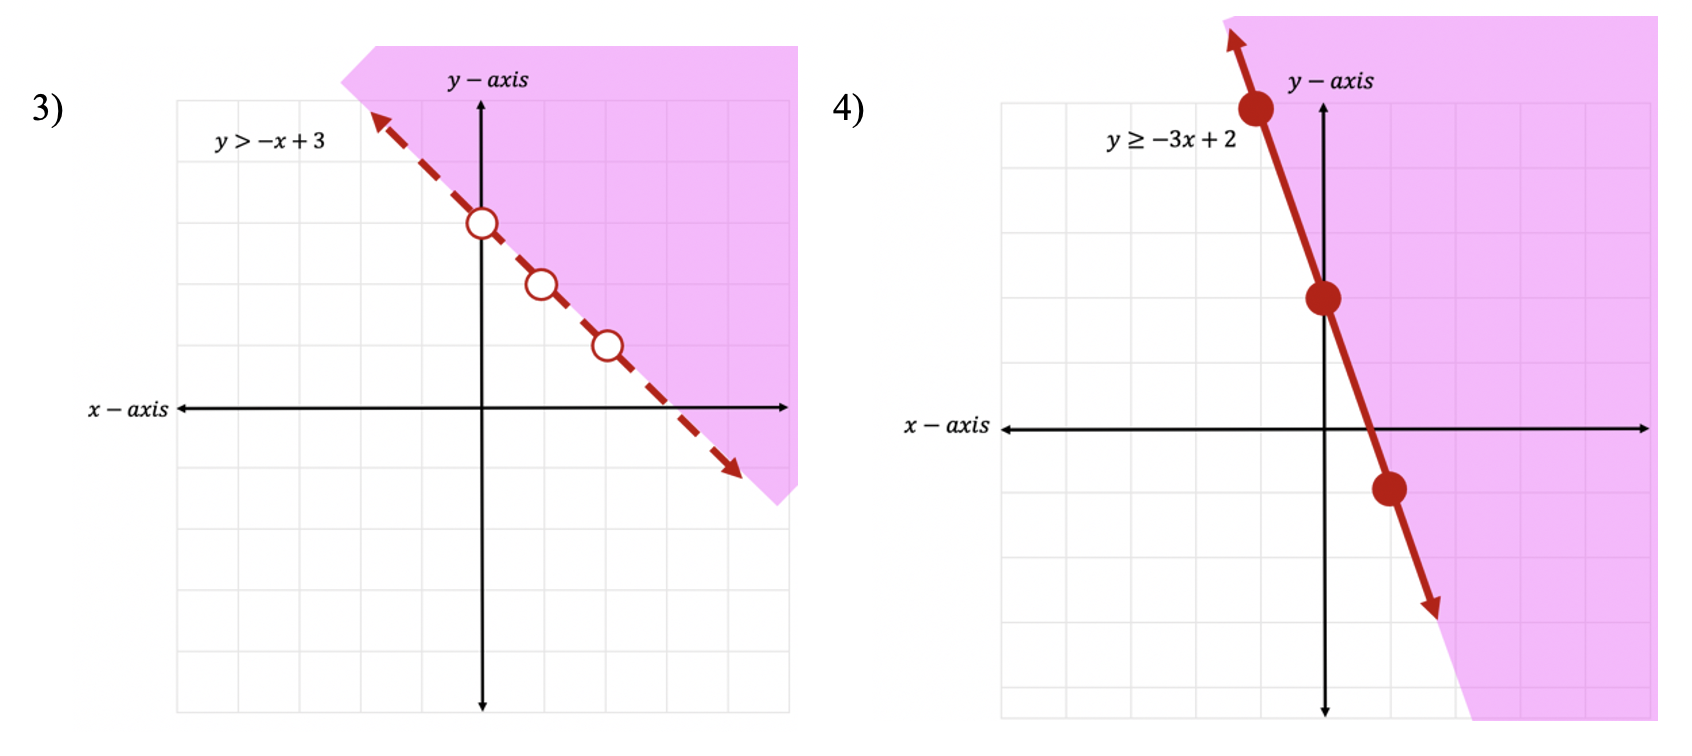
Solutions:


Still got questions? No problem! Don’t hesitate to comment with any questions or check out the video above for an in depth explanation. Happy calculating! 🙂
One thought on “Graphing Linear Inequalities: Algebra”