Hi there and welcome to MathSux! In this post, we are going to explore how to calculate z-score and the normal distribution. We’ll do this by examining the normal curve and learning how to find probability finding z-score and using the mean, standard deviation, and specific data points. Fore more info and more MathSix don’t forget to check out the video and practice questions below. Happy calculating!
What is a Normal Curve?
A normal curve is a bell shaped curve that shows the distribution of data evenly spread with respect to the mean. If you look at the normal curve below, the area under the curve shows all the possible probabilities of a certain data point occurring, notice the curve is higher towards the center mean, μ, and gets smaller as the distance from μ grows. The distance from μ is measured by the standard deviation, a unique unit of measurement that is specific to each group of data.
Mean: The mean always falls directly in the center of our normal curve. It is the average of our data, and always falls right in the middle.
Standard Deviation: This value is used as a standard unit of measurement for the data, measuring the distance between each data point in relation to the mean throughout the entire data set. For a review on what standard deviation is and how to calculate it, check out this post here.
Now for our normal curve:
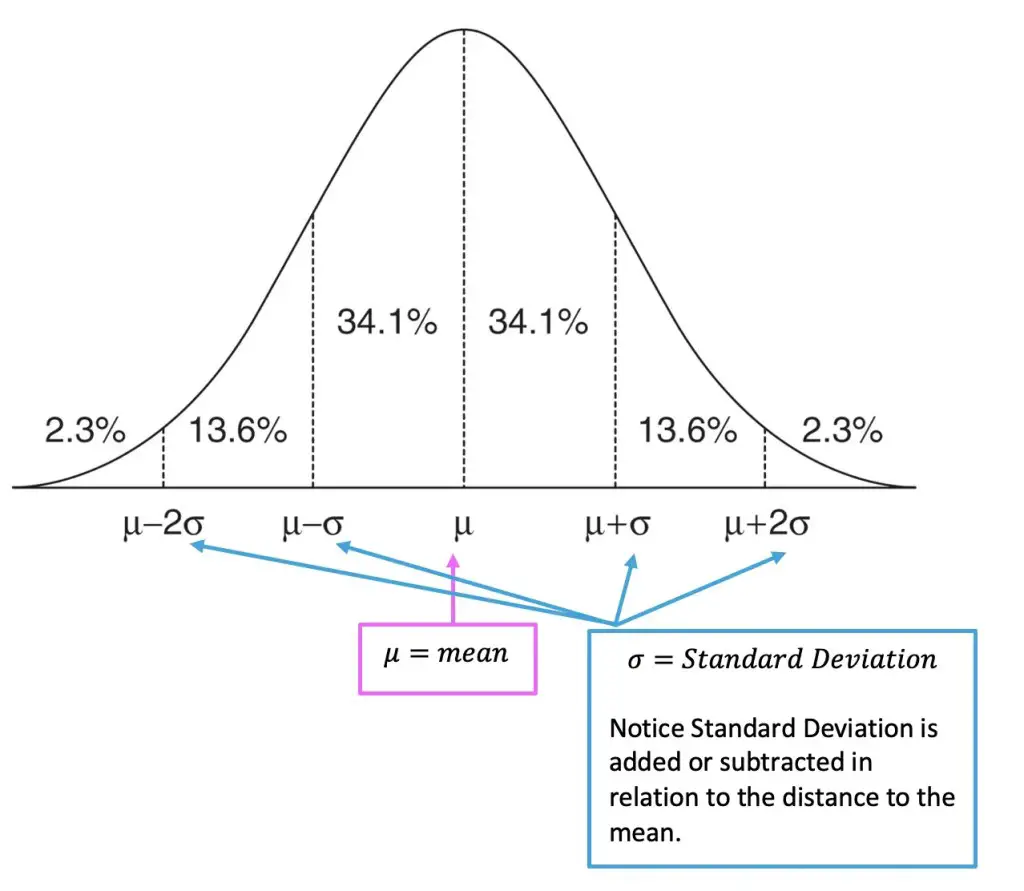
Notice half of the data is below the mean, μ, while the other half is above? The normal curve is symmetrical about the mean, μ!
How to Calculate Z-Score?
Z Score can tell us at what percentile a certain point in the data set falls in relation to the rest of the mean by using the standard deviation as a unit of measurement. If this sounds confusing, it’s ok! Take a look at the following formula:
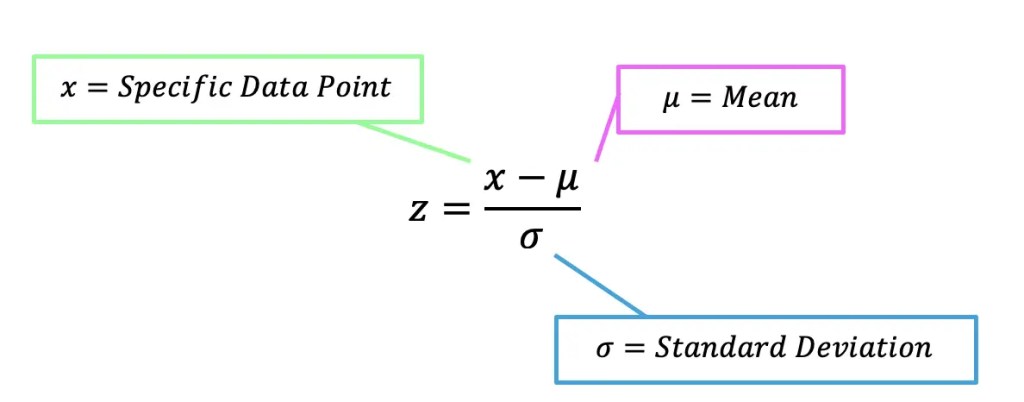
We use the above formula in conjunction with a z table which tells us the probability under the curve for a certain point.
Solution:
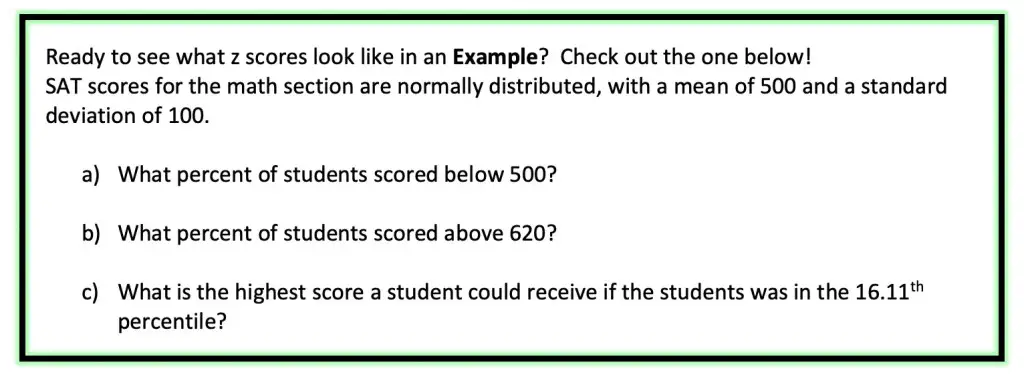
a) What percent of student scored below 500?
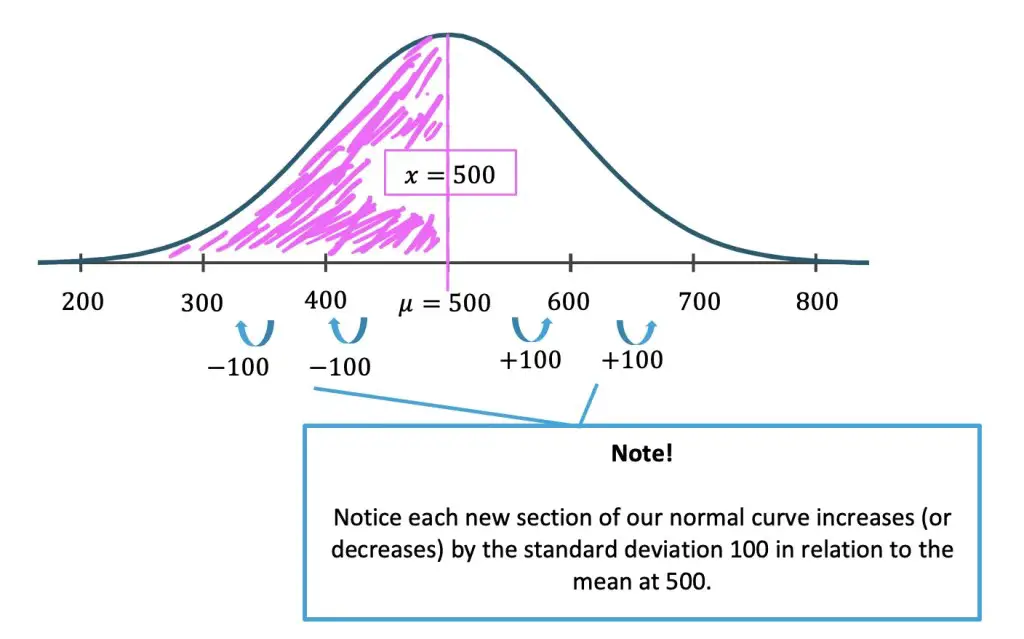
Step 1: First, let’s draw out our given information the mean=500, standard deviation=100, and the data point the question is asking for x=500 onto a normal curve. Notice that we want to find the value of the area under the curve shaded in pink. This will tell us the percent of students that scored below 500.
Step 2: We need to find the z-score by, using the data point given to us x=500, the mean=500, and the standard deviation, sigma=100.
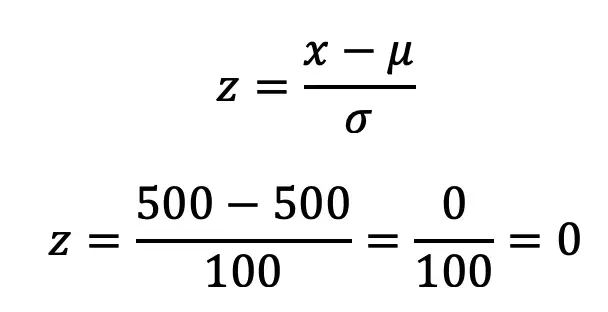
Step 3: Yes, we have a zero! Now we need to take our z table and line up our chart. Notice that the chart finds the probability for everything at the beginning of the normal curve and on. This is perfect for answering our question!
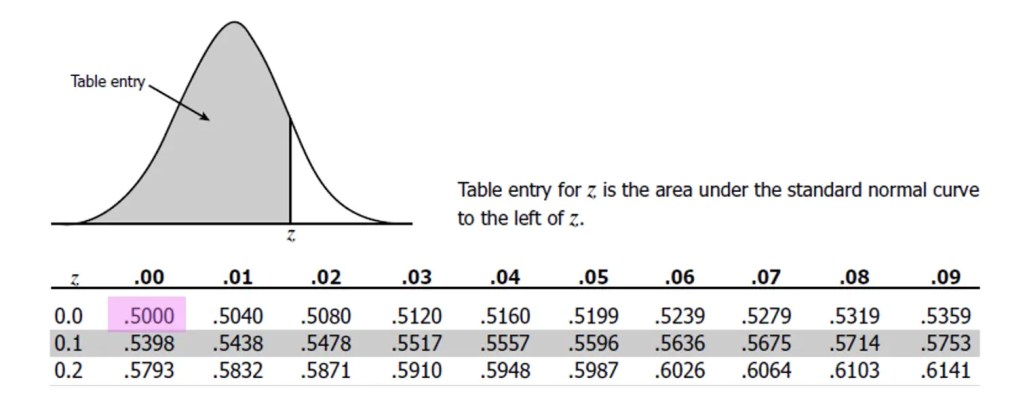
Step 4: The table gives us our solution of .5000. If we multiply .5000 times 100 it gives us the percent of students who scored below 500 at 50%.

b) What percent of student scored above 620?
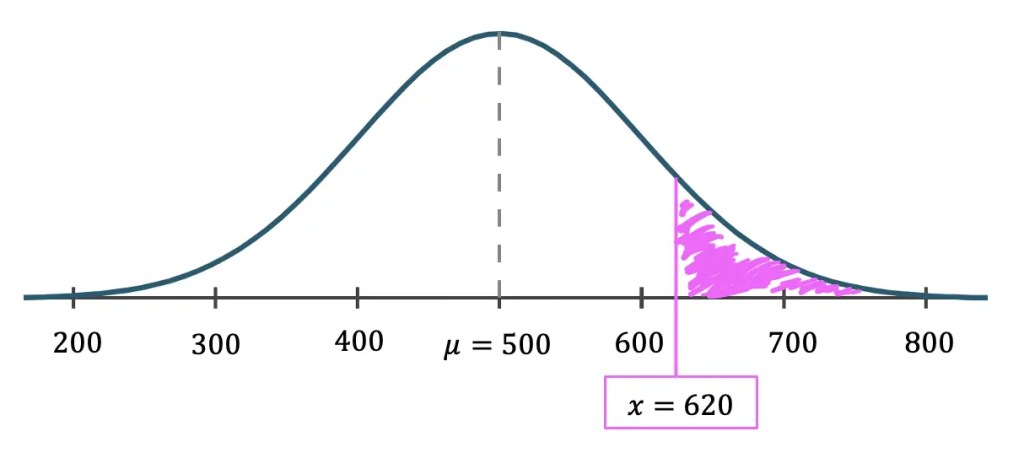
Step 1: First, let’s draw out our given information the mean=500, standard deviation=100, and the data point the question is asking for x=620 onto a normal curve. Notice that we want to find the value of the area under the curve shaded in pink. This will tell us the percent of students that scored above 620.
Step 2: We need to find the z-score by, using the data point given to us x=620, the mean=500, and the standard deviation, sigma=100.
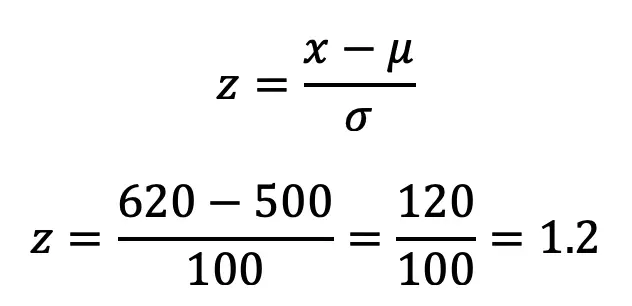
Step 3: Yes, we got 1.2! Now we need to take our z table and line up our chart. Notice that the chart finds the probability for everything at the beginning of the normal curve and on. This is means to find the percent we are looking for, we need to subtract our answer from one since we want the value of probability on the right side of the curve (the z-table only provides the left side).
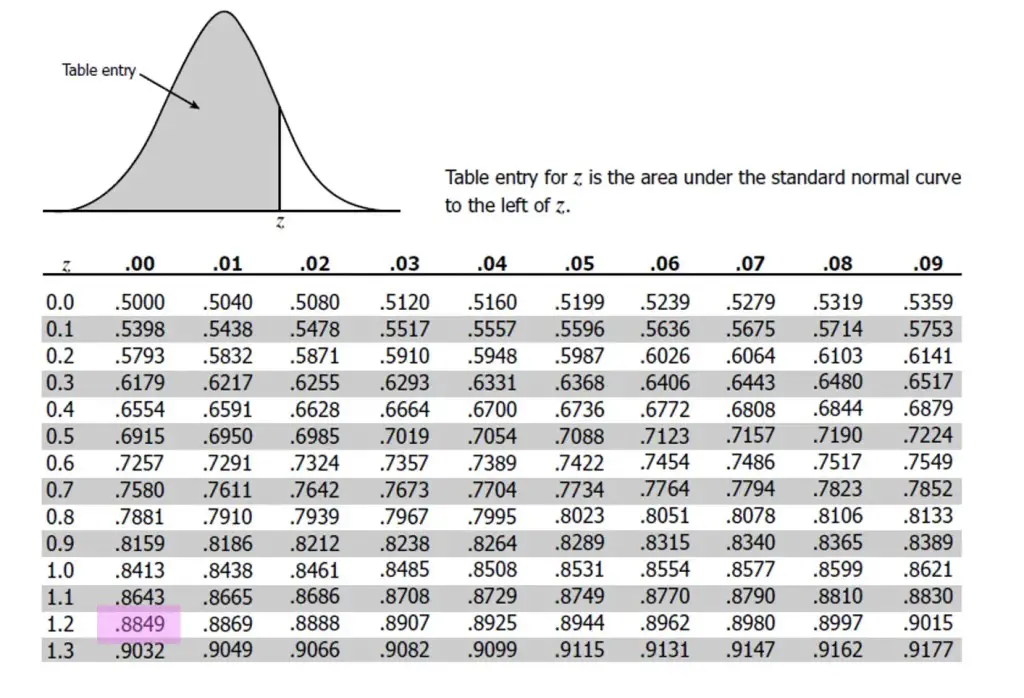
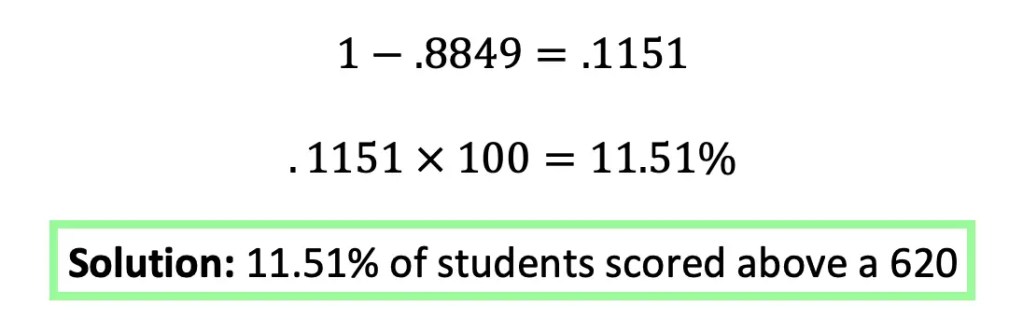
Step 4: The table gives us our solution of .8849. If we subtract this value from 1 then multiply that value times 100 it gives us the percent of students who scored above 620.
C) What is the highest score a student could receive if the students was in the 16.11th percentile?
Step 1: In this question we have to work backwards by first identifying, where on the z-score table is the number .1611 and then filling in our z score formula to find x, the missing data point (in this case test score).
Search the table for .1611:
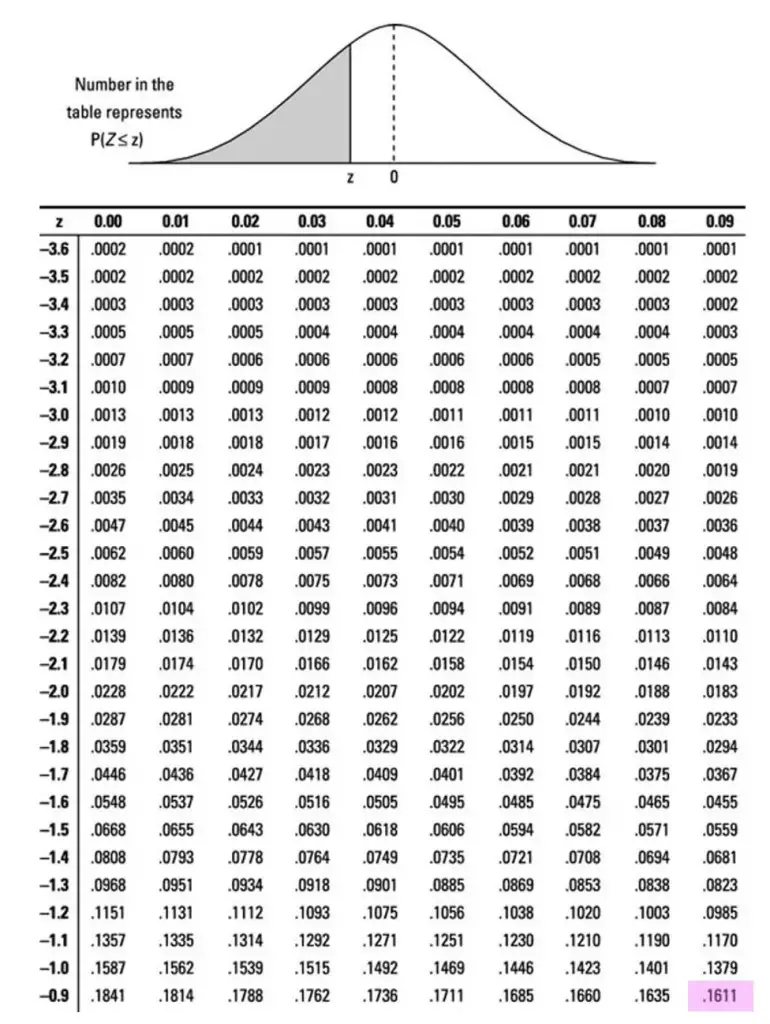
Notice that .1611 can be found on the z-table above with z-score -0.99. This is what we’ll use to find the unknown data point!
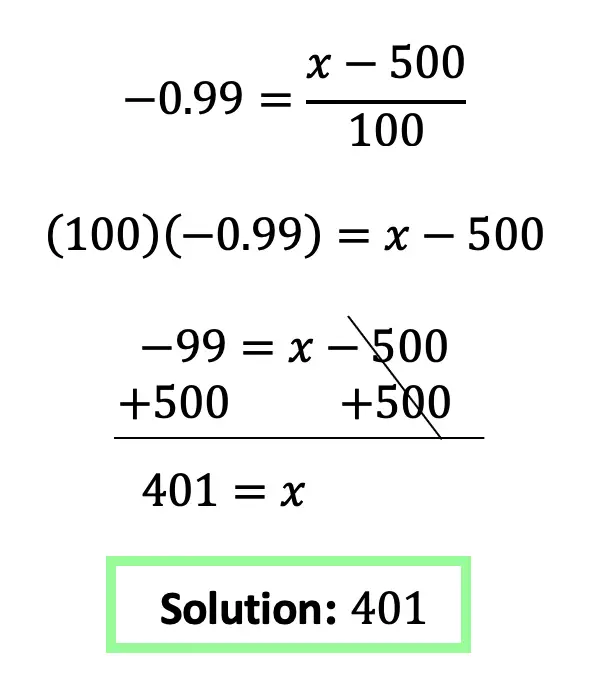
Step 2: We need to find the unknown test score by, using the z score we just found z=-0.99, the mean=500, and the standard deviation, sigma=100.
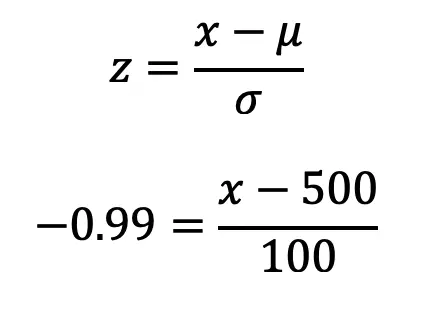
Step 3: Solve for x.
Practice Questions:
The grades on a final English exam are normally distributed with a mean of 75 and a standard deviation of 10.
a) What percent of students scored below a 60?
b) What percent of students scored above an 89?
c) What is the highest possible grade that included in the 4.46th percentile?
d) What percent of students got at least a 77?
Solutions:
a) 6.68%
b) 8.08%
c) 58
d) 42.07%
Want to make math suck just a little bit less? Subscribe to my Youtube channel for free math videos every week! 🙂
Facebook ~ Twitter ~ TikTok ~ Youtube
Looking for more Statistics?
Difference between Bar Graphs and Histograms
Variance and Standard Deviation