Hi everyone and welcome to MathSux! This post is going to help you pass Algebra 2/Trig. In this post, we are going to apply our knowledge of the unit circle and trigonometry and apply it to graphing trig functions y=sin(x), y=cos(x), and y=tan(x). We have been using trig functions in basic trigonometry, but today, we will see what each function (sin, cos, and tan) look like graphed on a coordinate plane.
If you are already familiar with the basics of graphing trig functions and want to learn how to transform them, including knowing how to identify the amplitude, period frequency, vertical shift, and horizontal phase shift, then please check out this post here on transforming trigonometric functions.
If you have any questions, don’t hesitate to comment or check out the video below. Thanks for stopping by and happy calculating! 🙂
How do we get coordinate points for graphing Trigonometric Functions?
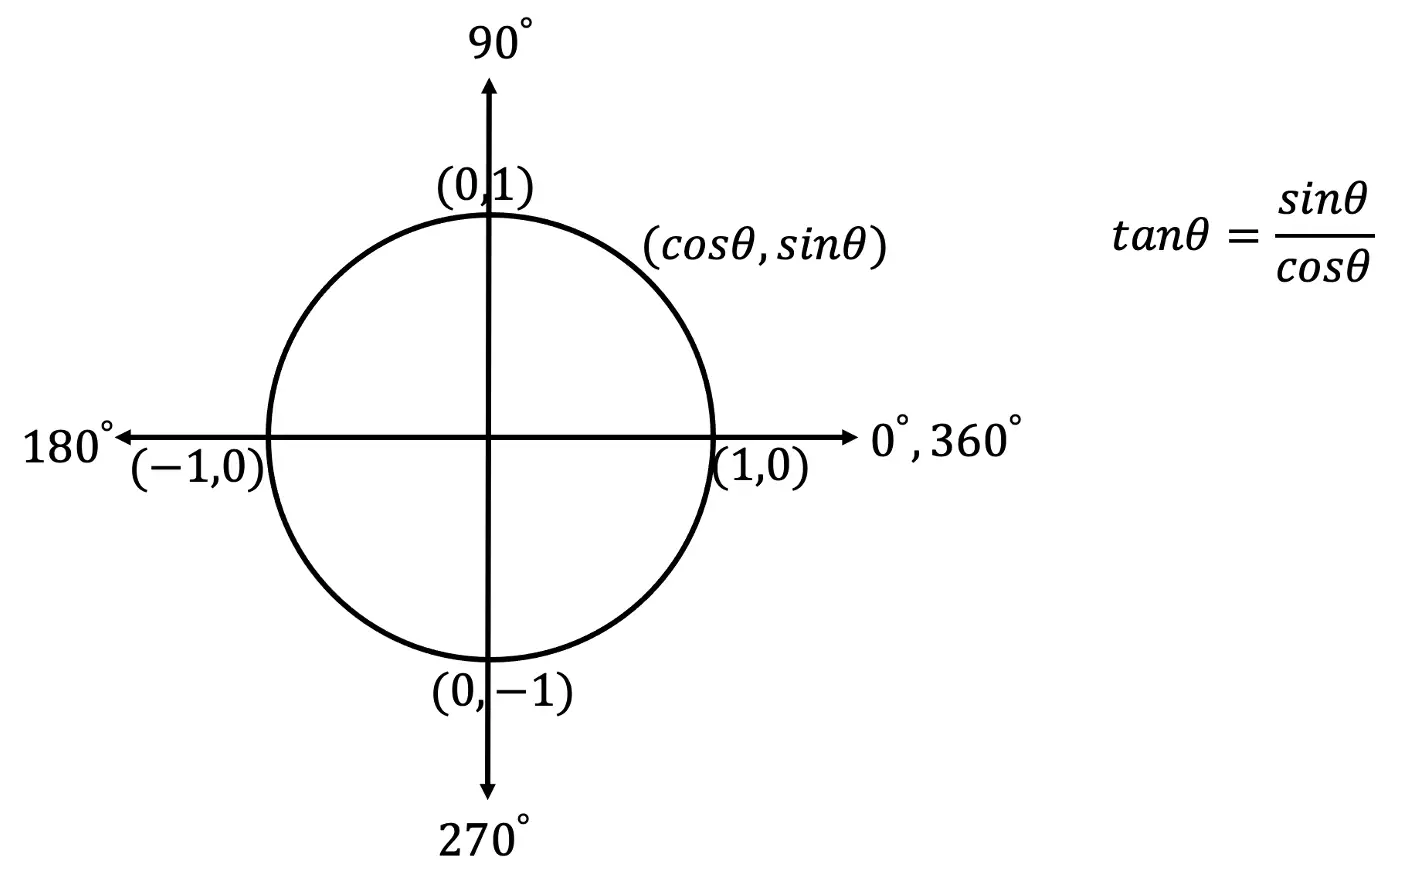
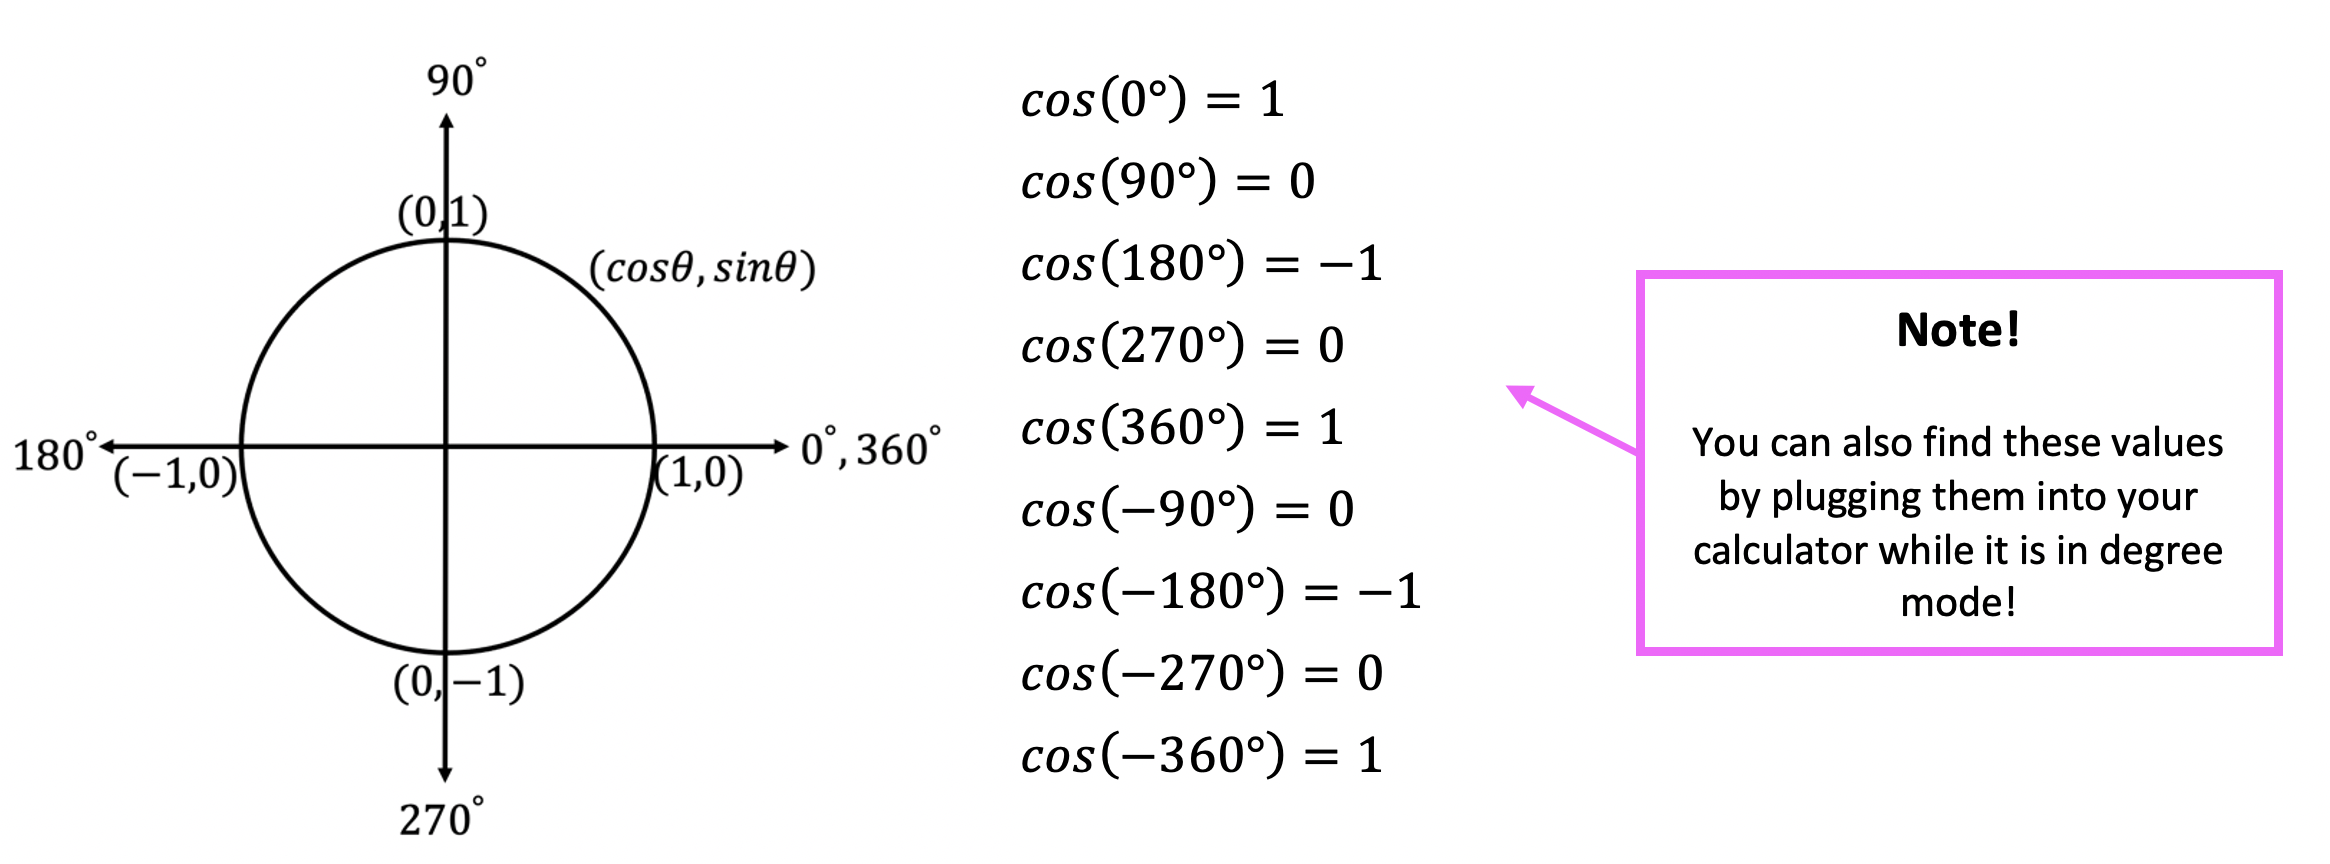
For deriving our trigonometric function graphs [y=sin(x), y=cos(x), and y=tan(x)] we are going to write out our handy dandy Unit Circle. By looking at our unit circle and remembering that coordinate points are in (cos(x), sin(x)) form and that tanx=(sin(x))/(cos(x)) we will be able to derive each and every trig graph!
*Note below is the unit circle we are going to reference to find each value, for an in-depth explanation of the unit circle, check out this link here.
How to Graph y=sin(x)?
While Graphing Sine, you may notice that the sine function curves creates what looks like an “S” shape. As they say, “S” is for Sine, this is the easiest way to remember what the sine function looks like! Check it out below.
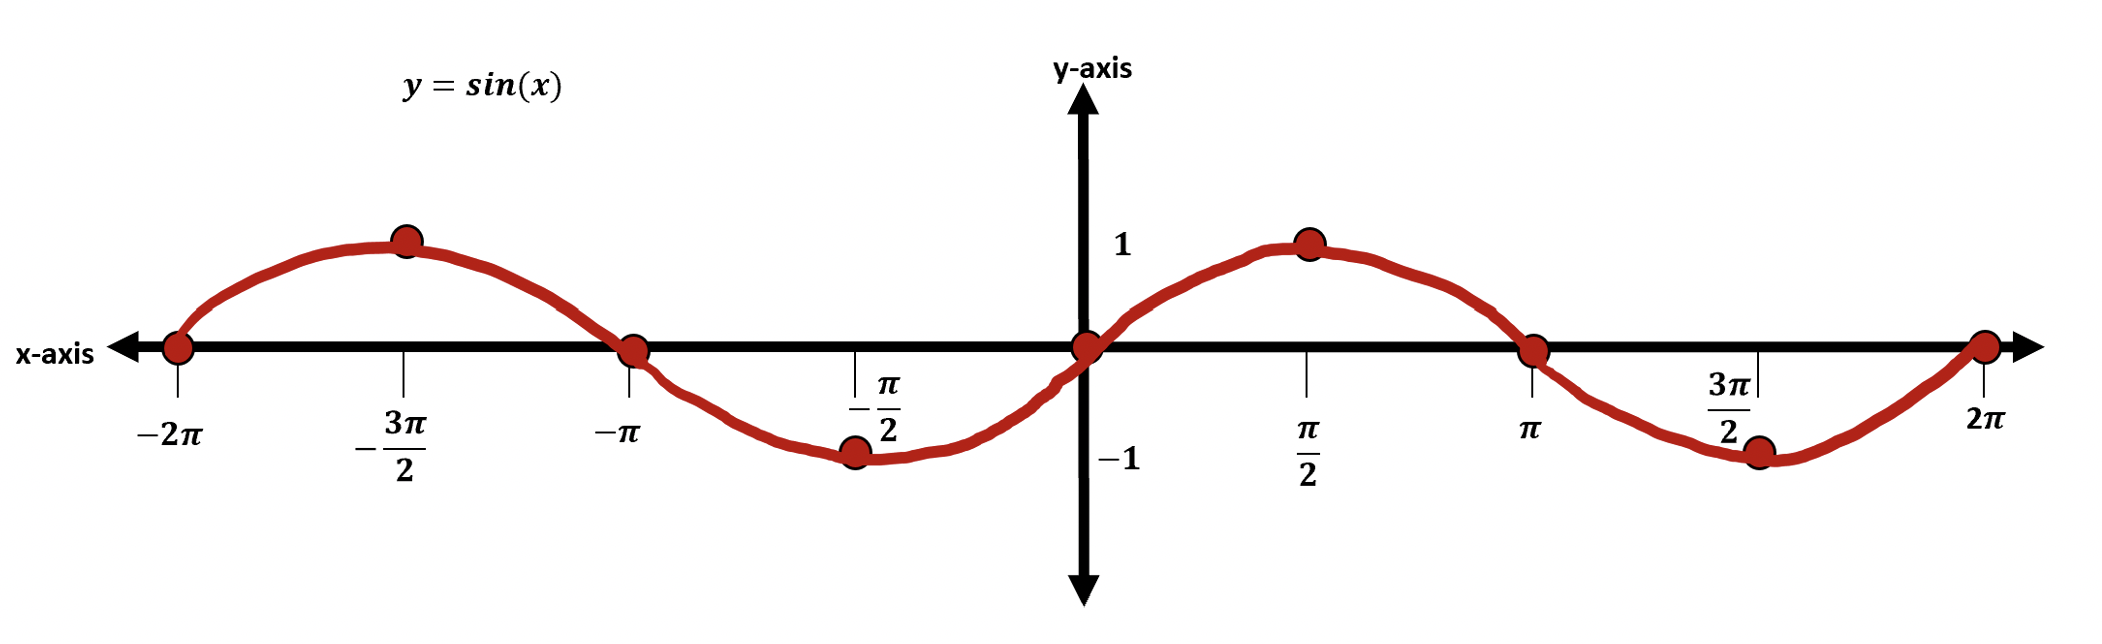
Now that we know what the sine function looks like once it’s graphed, let’s see why it looks that way in the first place by deriving each coordinate point with the help of the unit circle.
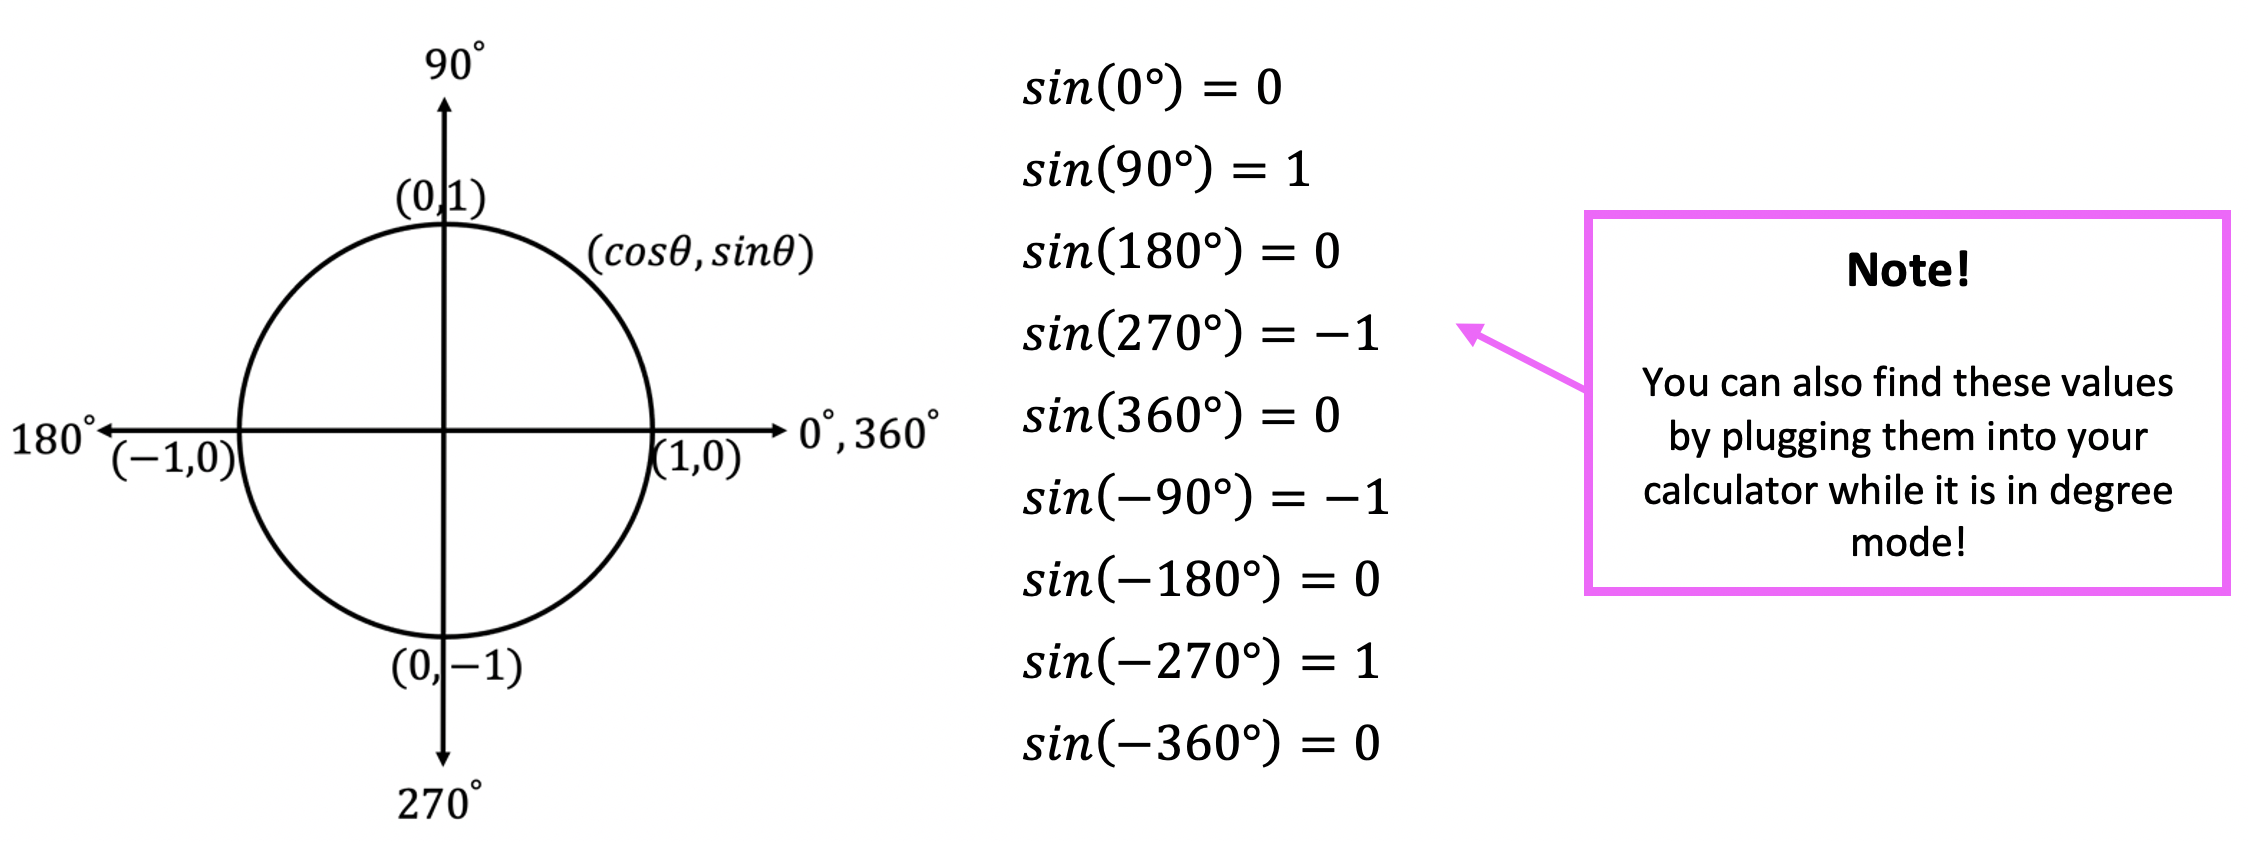
Step 1: We are going to derive each degree value for sin by looking at the unit circle. These will be our coordinates for graphing y=sin(x). *For a review on how to get these values, check out the link here explaining the unit circle.
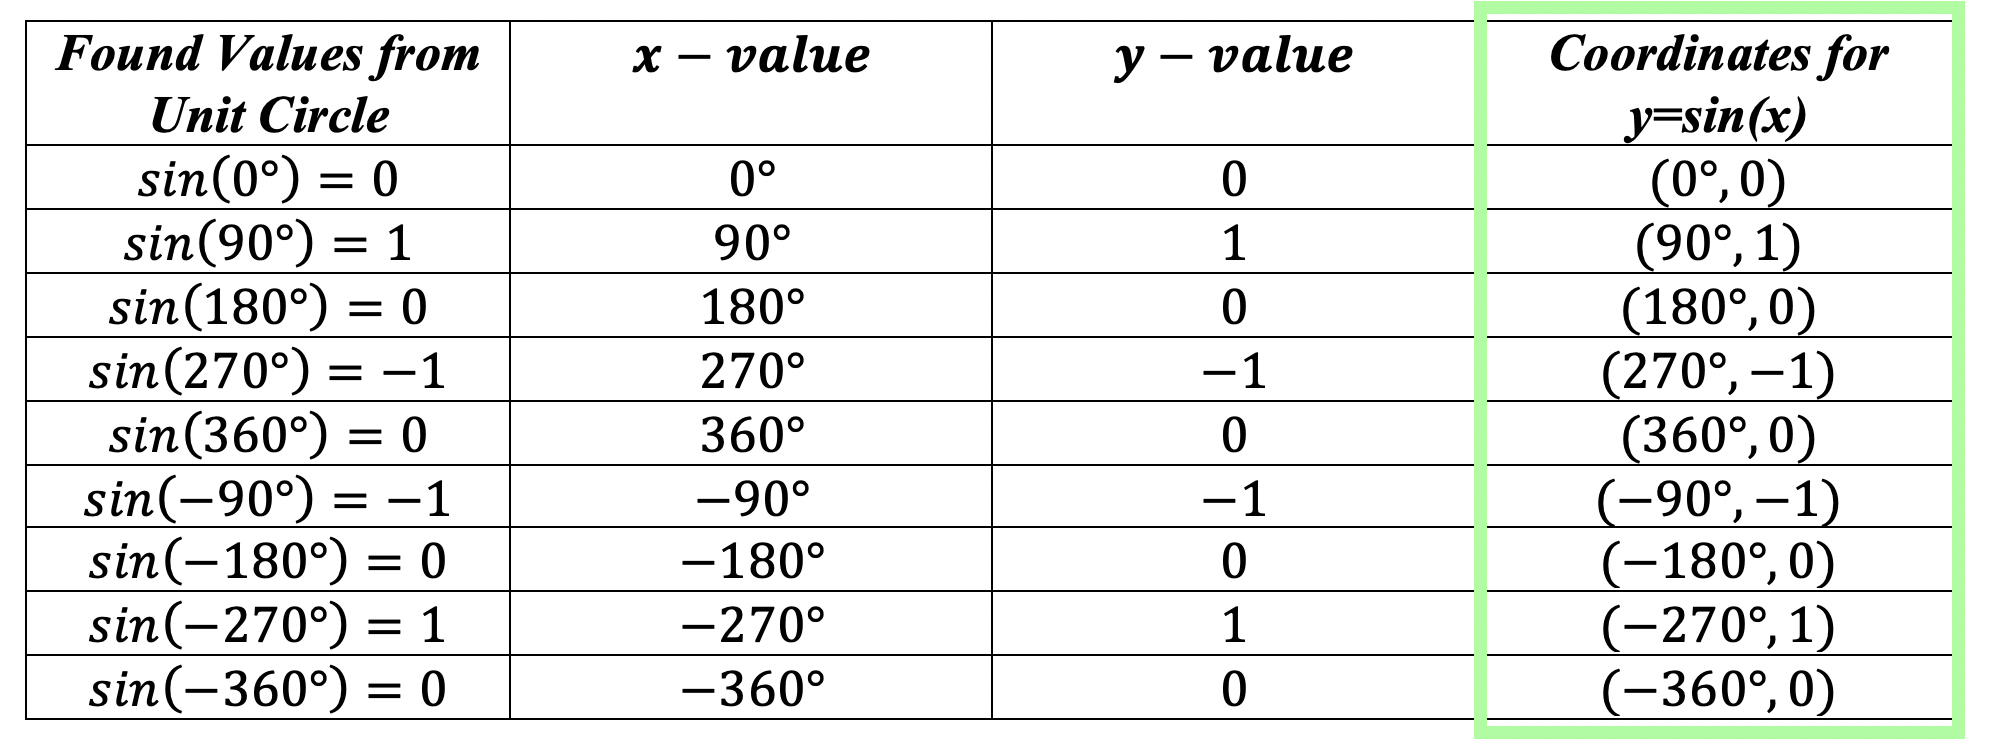
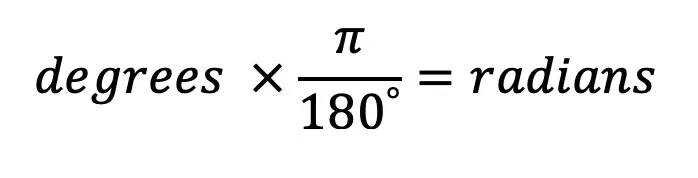
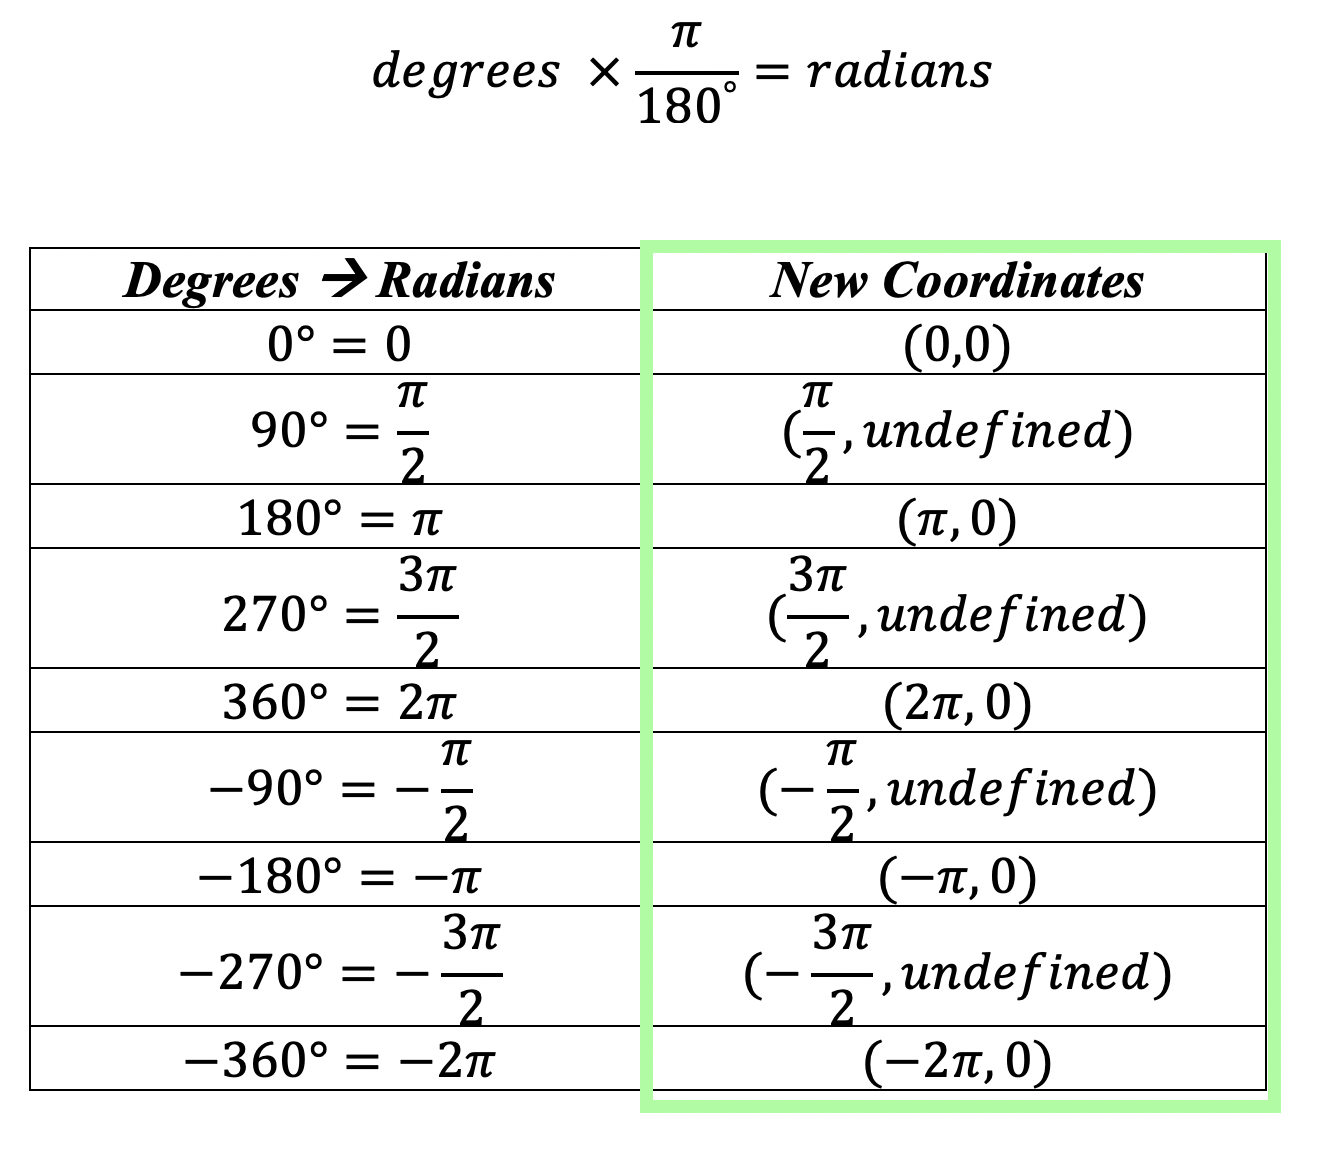
Step 2: Now we need to convert all the x-values from degrees to radians. Fear not because this can be done easily with a simple formula!
To convert degrees à radians, just use the formula below:
Step 3: Now that we have our coordinate points and converted degrees to radians, we can draw out our function y=sin(x) on the coordinate plane!
Now we will follow the same process for graphing y=cos(x) and y=tan(x).
How to Graph y=cos(x)?
While Graphing Cosine, you may notice that the cosine function creates what looks like a “V” shape. I always like to think “V” is for victory, but of course, in this case, it is for cosine, that is the easiest way to remember what this function looks like! Check it out below.
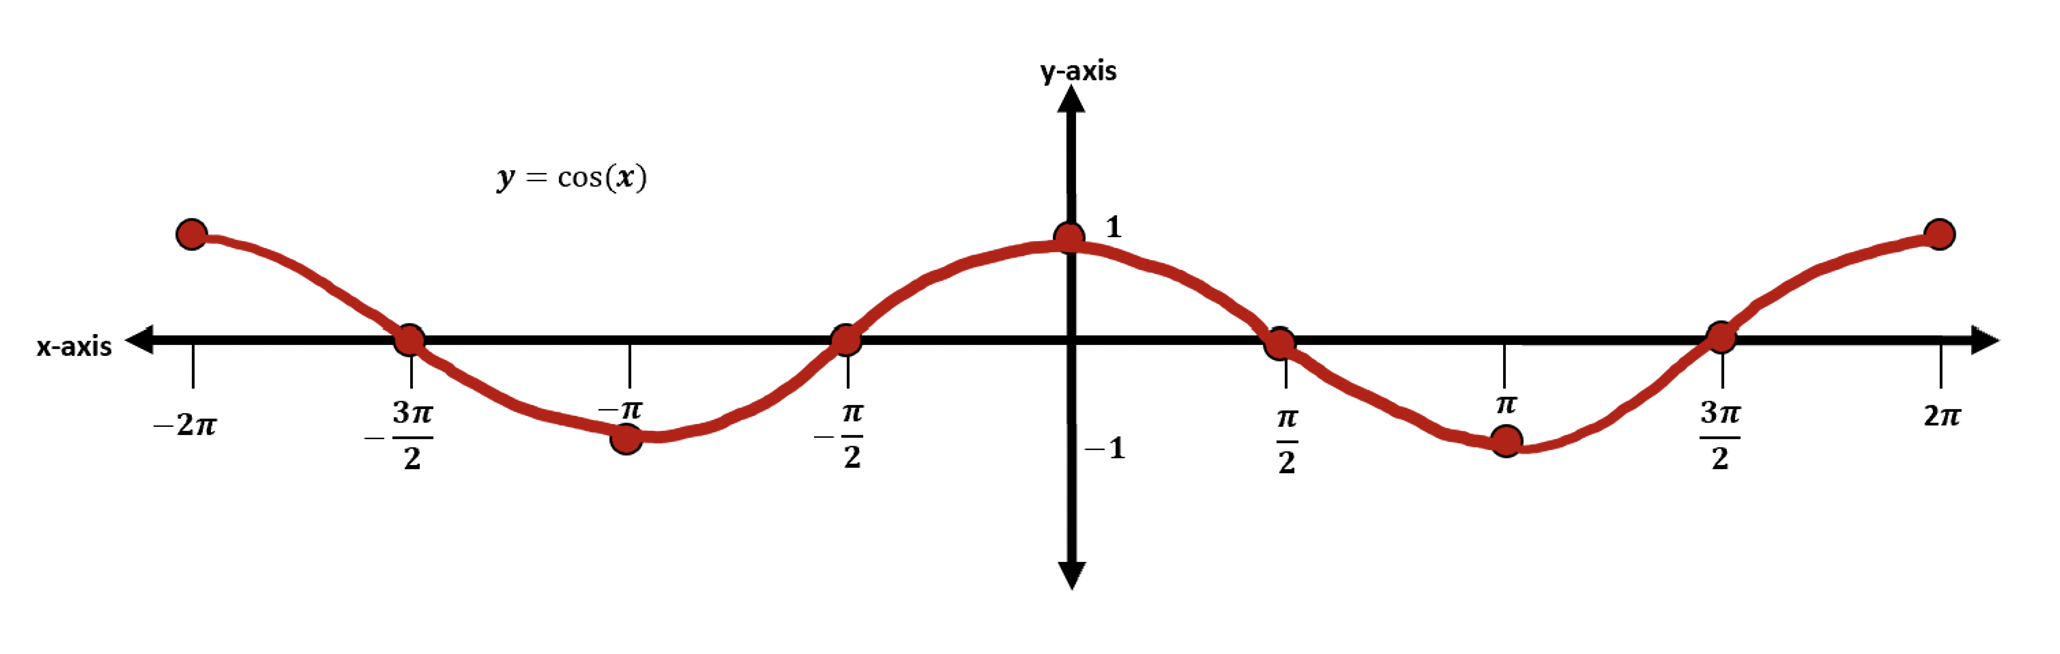
Now that we know what the cosine function looks like once graphed, let’s see why it looks this way in the first place by deriving each coordinate point with the help of the unit circle.
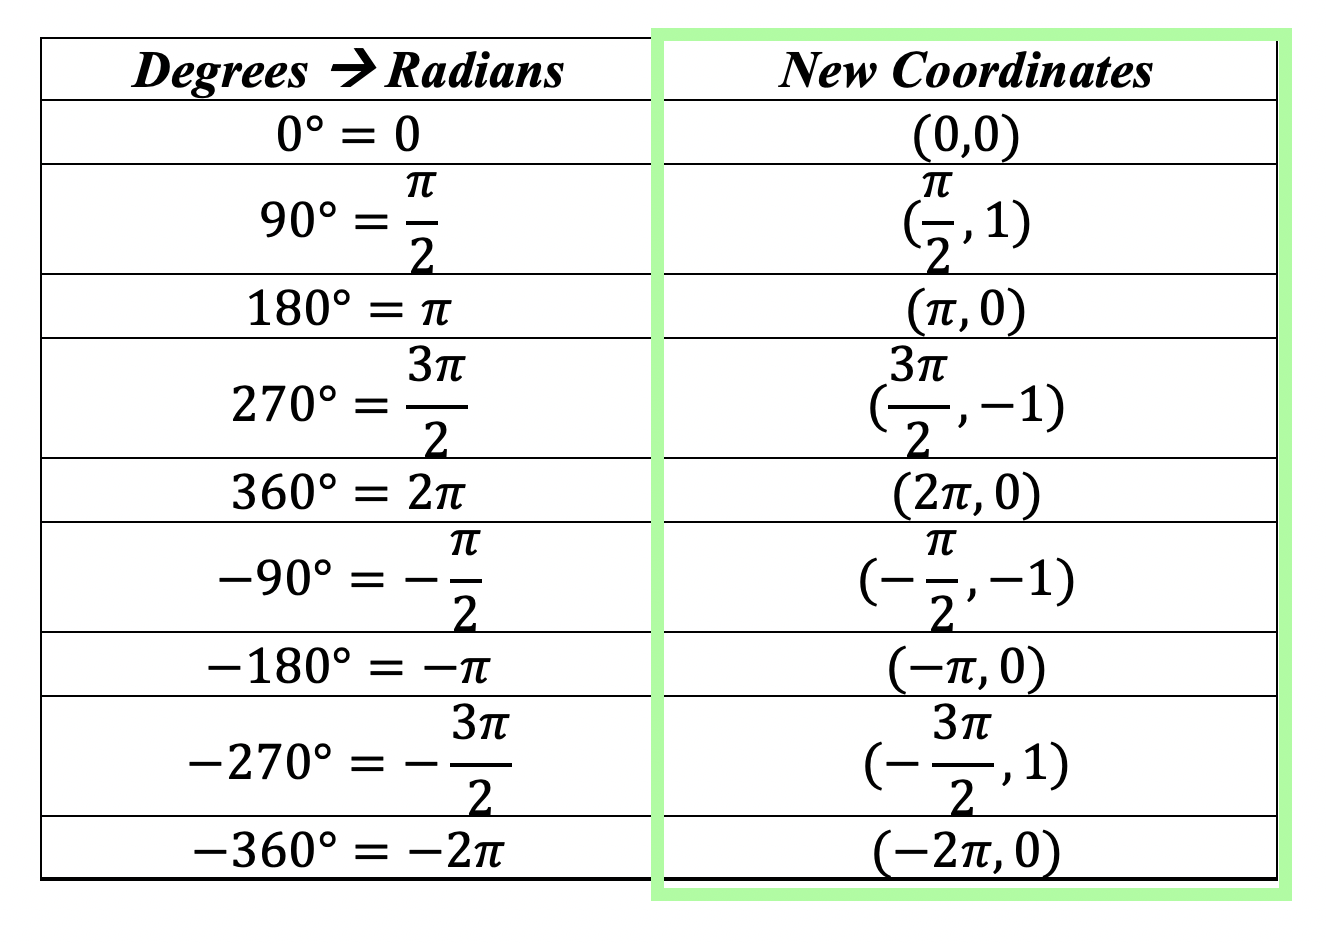
Step 1: We are going to derive each degree value for cos by looking at the unit circle. These will be our coordinates for graphing y=cos(x). *For a review on how to get these values, check out the link here explaining the unit circle.
Step 2: Now we need to convert all the x-values from degrees to radians.

Step 3: Now that we have our coordinate points and converted degrees to radians, we can draw out our function y=cos(x) on the coordinate plane!
What do you think would happen if we were to vertical shift our entire function up by one unit? Or move our entire function to the left by 90 degrees with a horizontal phase shift? Check out what happens here!
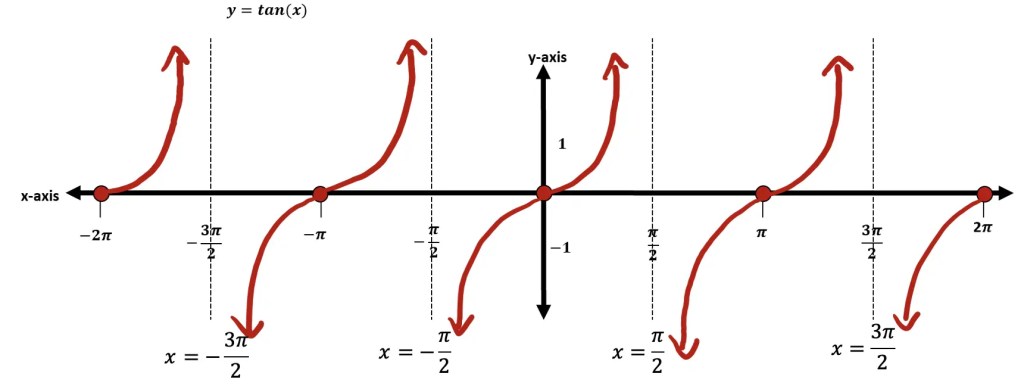
How to Graph y=tan(x)?
While Graphing Tangent, you may notice that the tangent function looks totally different than sine or cosine. Check it out below.
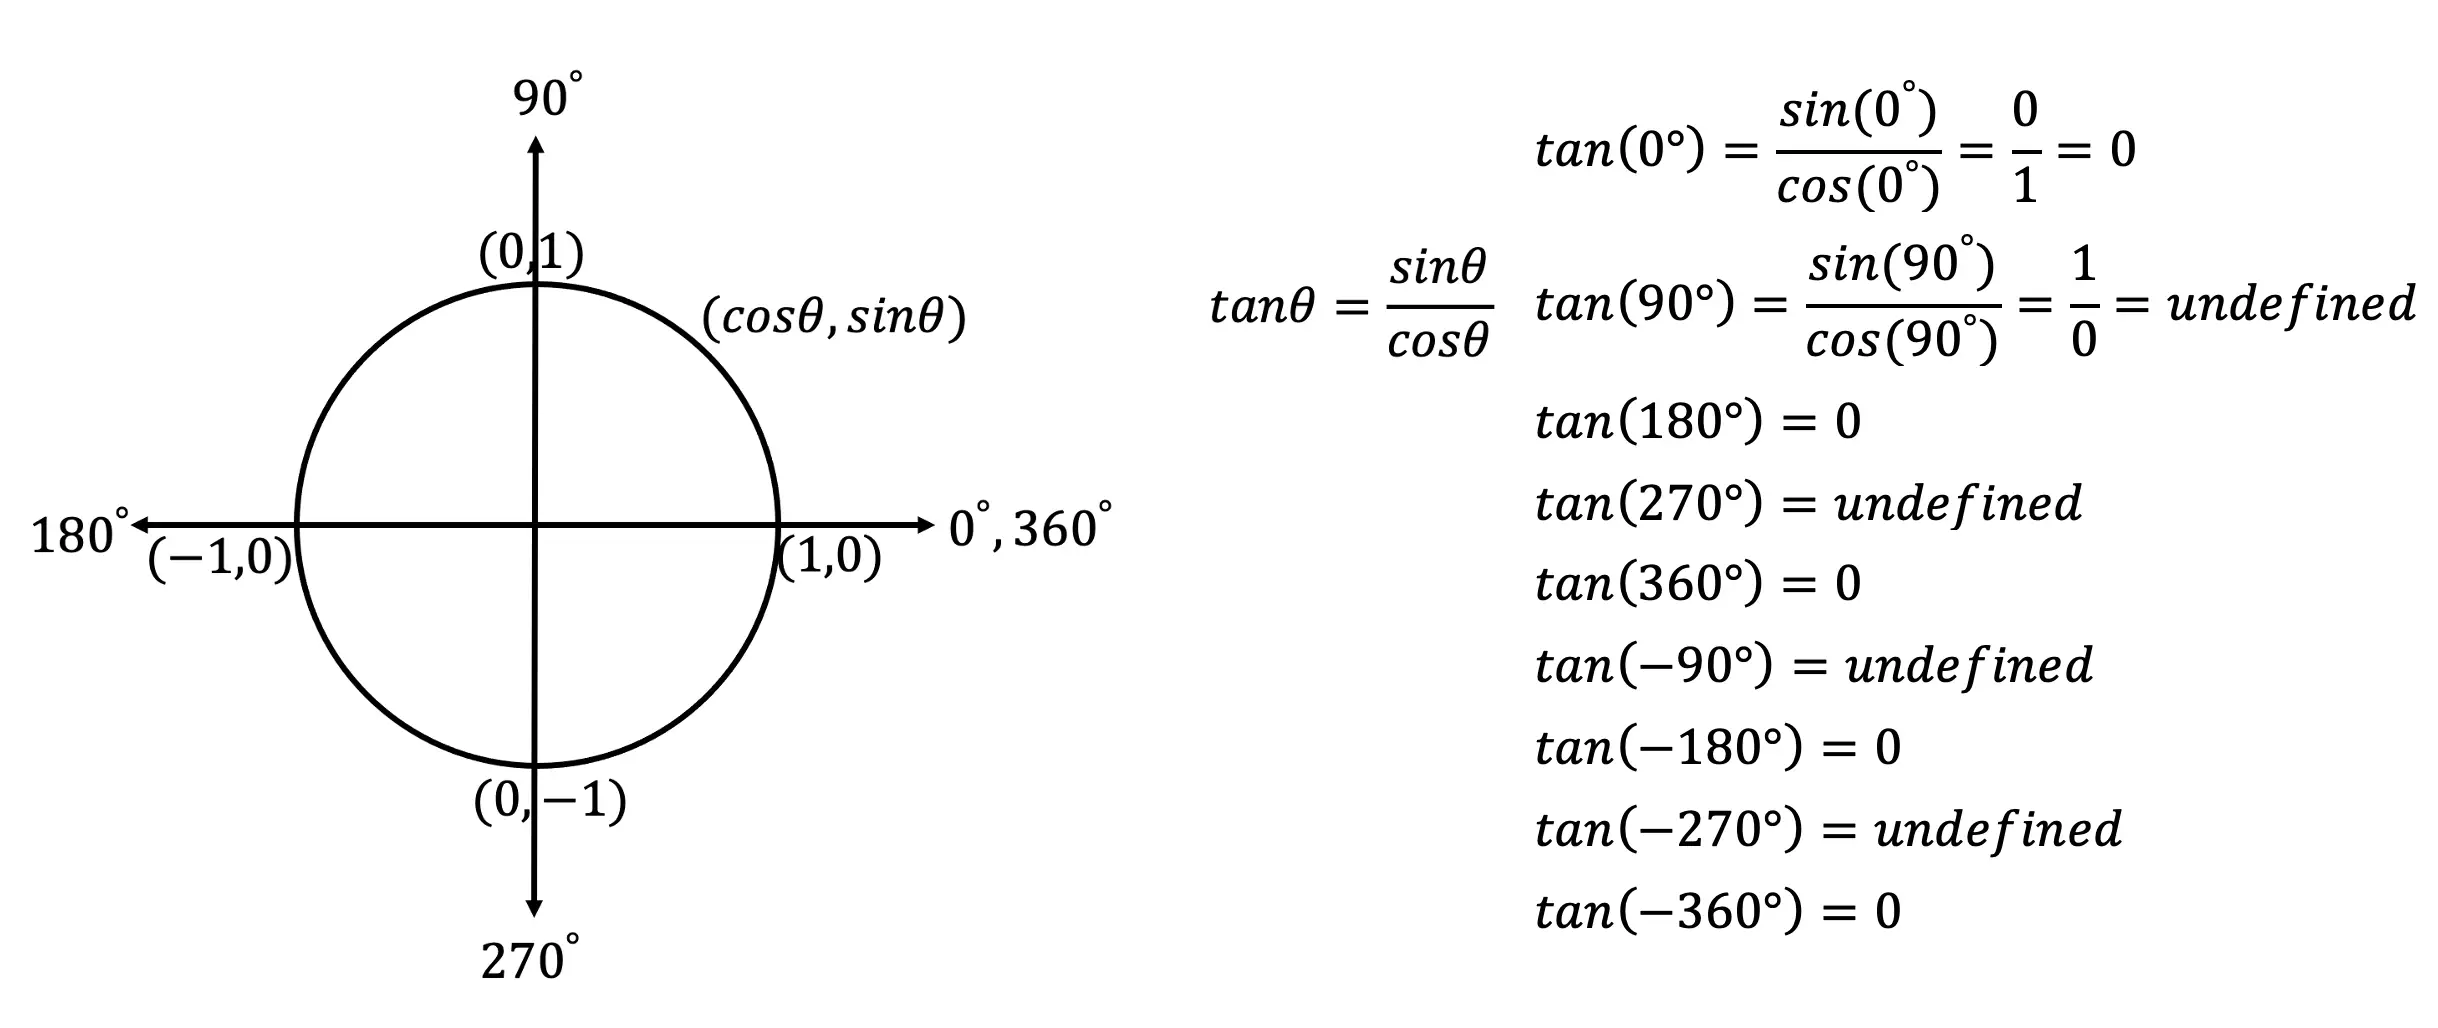
Step 1: We are going to derive each degree value for the tangent function by looking at the unit circle. In order to derive values for tan(x), we need to remember that tan(x)=sin(x)/cos(x). Once found, these will be our coordinates for graphing y=tan(x). *For a review on how to get these values, check out the link here explaining the unit circle.
Step 2: Now we need to convert all the x-values from degrees to radians.
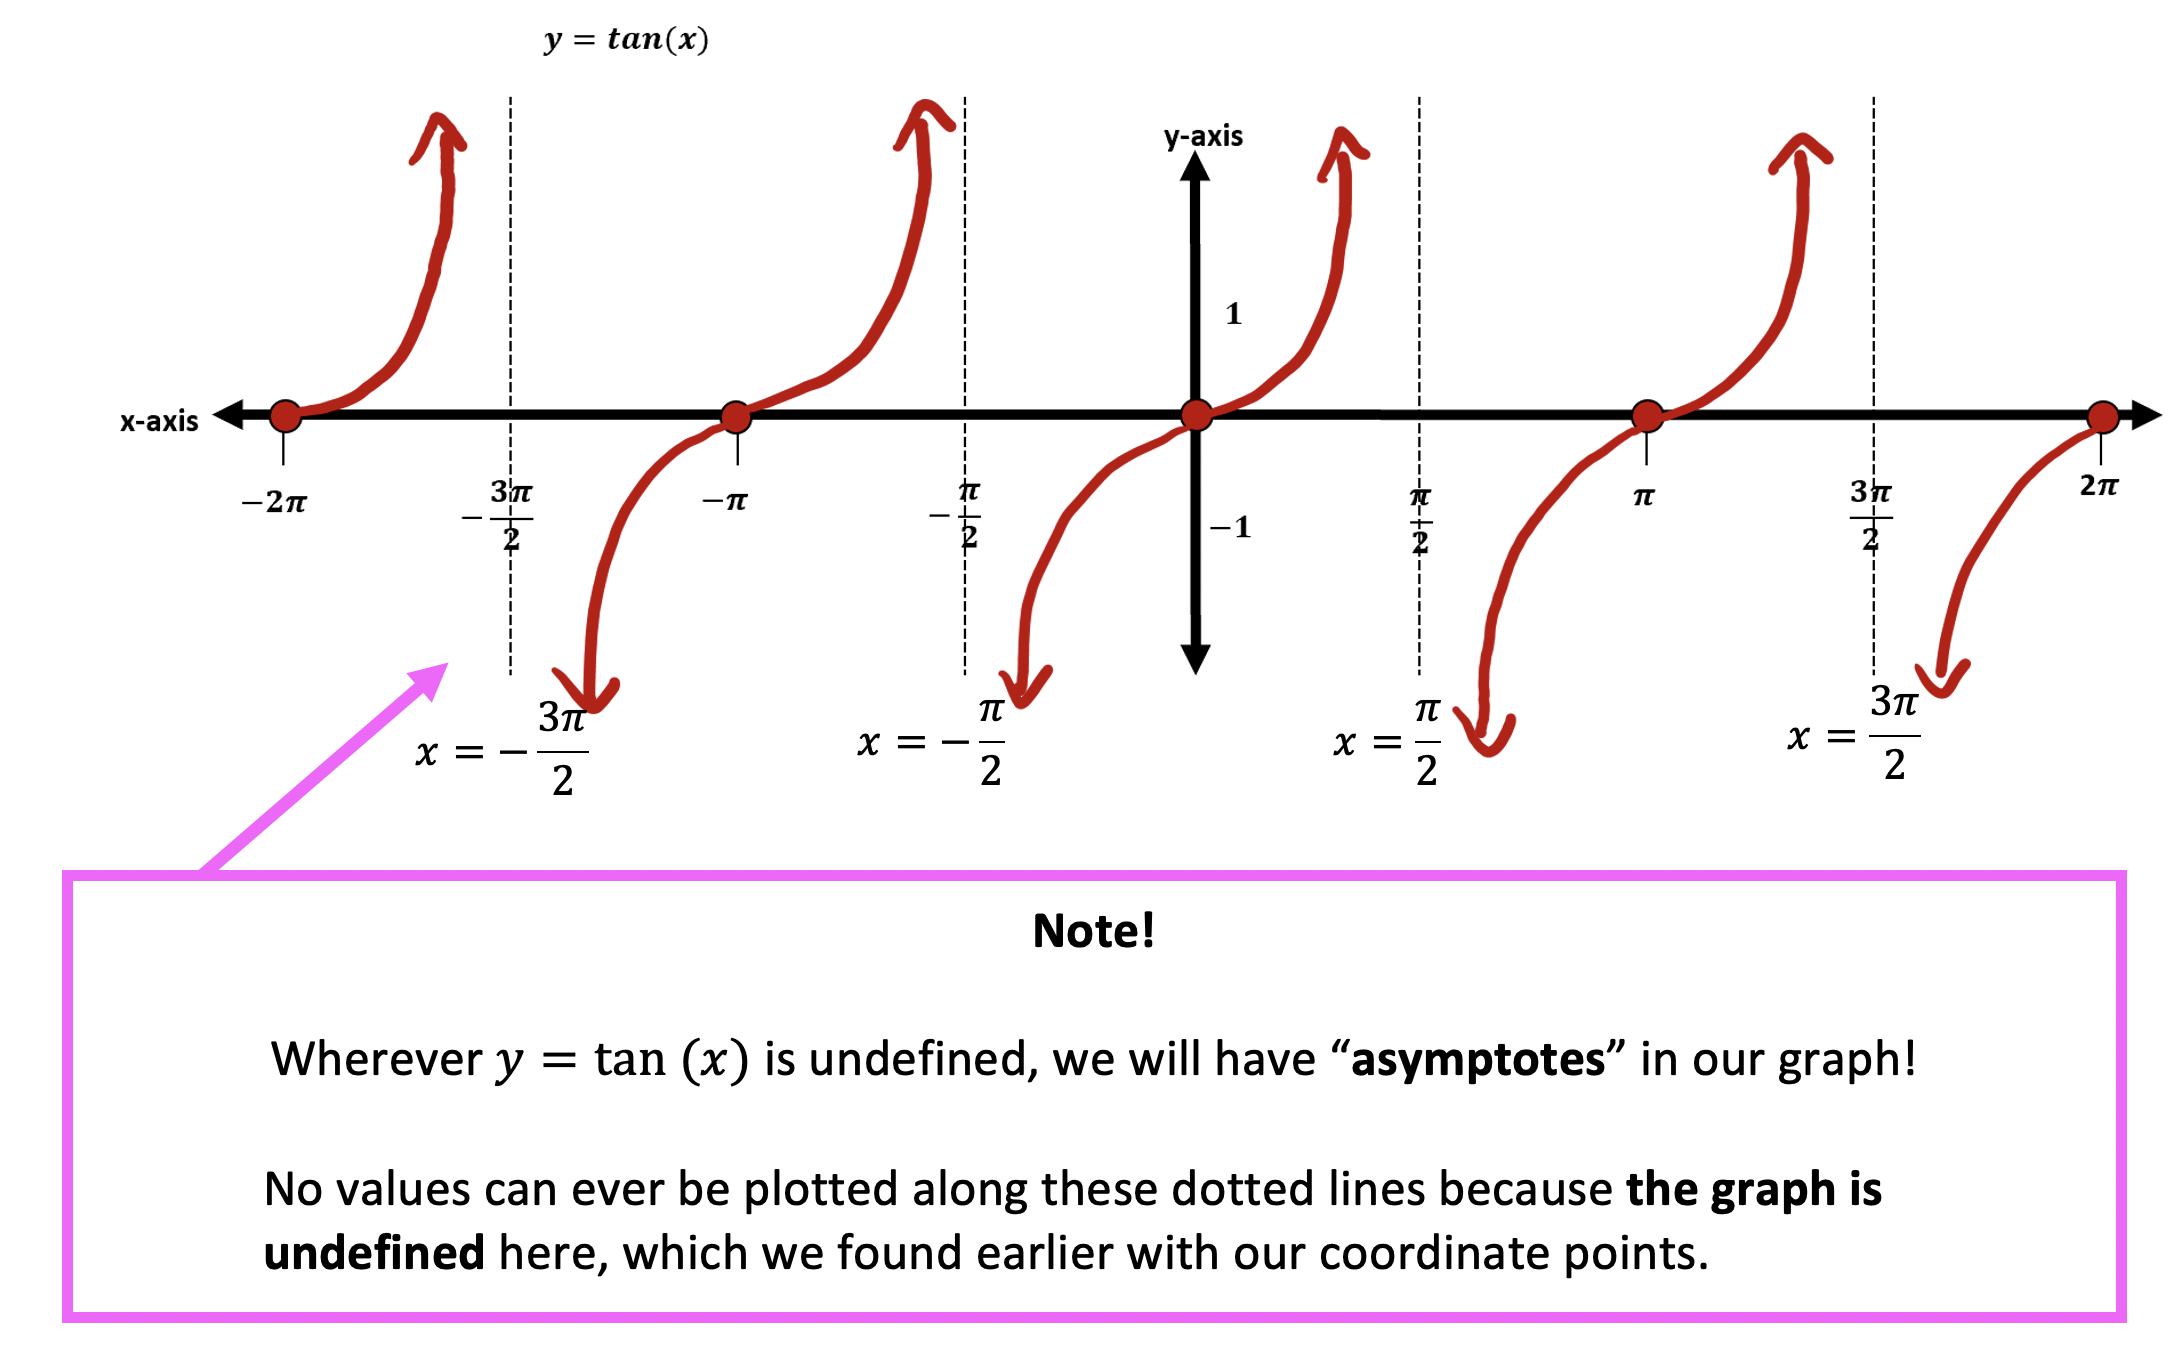
Step 3: Now that we have our coordinate points and converted degrees to radians, we can draw out our function y=tan(x) on the coordinate plane!
Still got questions? No problem! Don’t hesitate to comment with any questions or check out the video above for an in-depth explanation. Happy calculating! 🙂
Facebook ~ Twitter ~ TikTok ~ Youtube
Ready for the next lesson? Now that you know the basics of graphing the sine, cosine, and tangent functions, learn how to transform each trig function on a coordinate plane by identifying the amplitude, period frequency, vertical shift, and horizontal phase shift of each function, by checking out this post here on transforming trigonometric functions. When you’re ready for more, check out the related trig posts below!
Related Trigonometry Posts:
Basic Right Triangle Trigonometric Ratios (SOH CAH TOA)
4 thoughts on “Graphing Trig Functions: Algebra 2/Trig.”