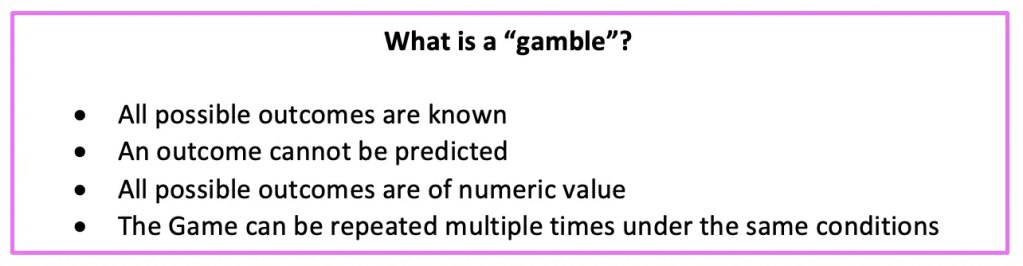
Greeting math friends! Today, we are going to dive into statistics by learning how to find the expected value of a discrete random variable. To do this we will need to know all potential numeric outcomes of a “gamble,” as well as be able to repeat the gamble as many time as we want under the same conditions, without knowing what the outcome will be. But I’m getting ahead of myself, all of this will be explained below with two different examples step by step! Don’t forget to check out the video and practice questions at the end of this post to check your understanding. Happy calculating! 🙂
What is Expected Value?
Expected Value is the weighted average of all possible outcomes of one “game” or “gamble” based on the respective probabilities of each potential outcome.
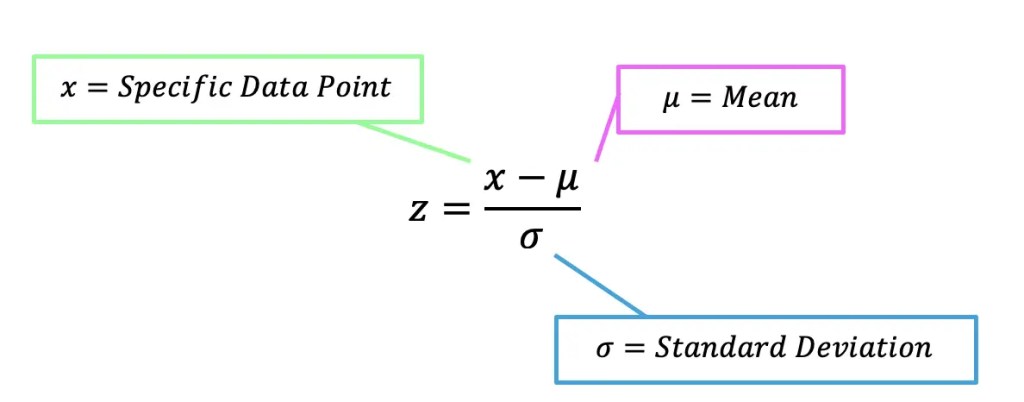
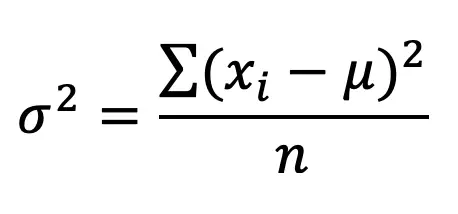
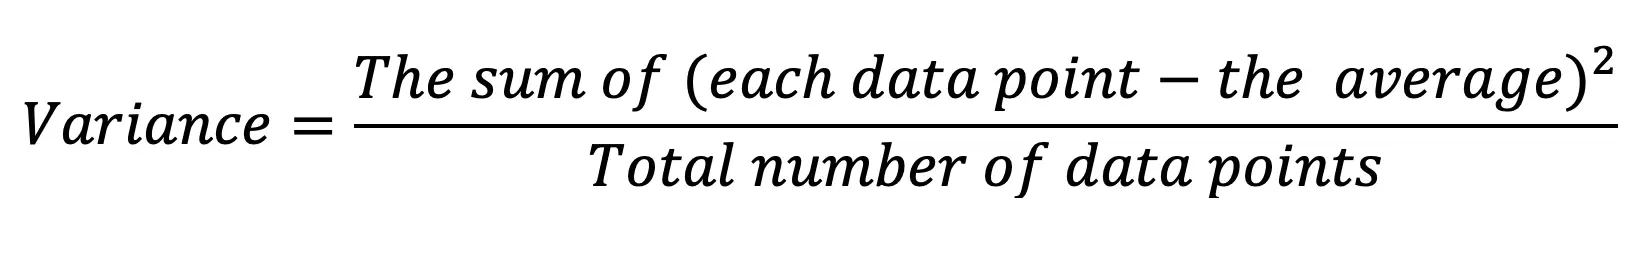
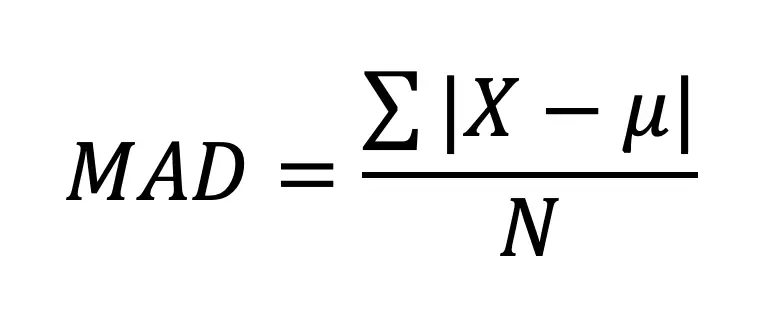
Expected Value Formula: Don’t freak out because below is the expected value formula.
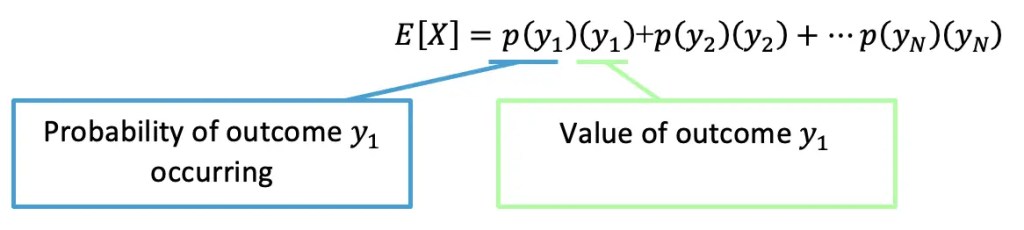
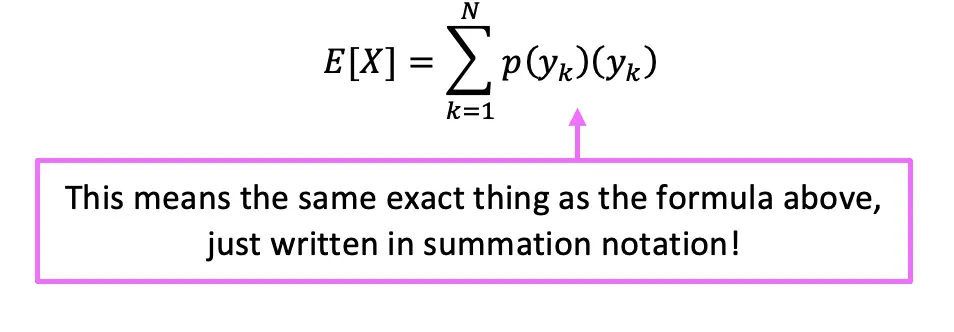
In essence, we are multiplying each outcome value by the probability of the outcome occurring, and then adding all possibilities together! Since we are summing all outcome values times their own probabilities, we can re-write the formula in summation notation:
Does the above formula look insane to you? Don’t worry because we will go over two examples below that will hopefully clear things up! Let check them out:
Example #1: Expected Value of Flipping a Coin
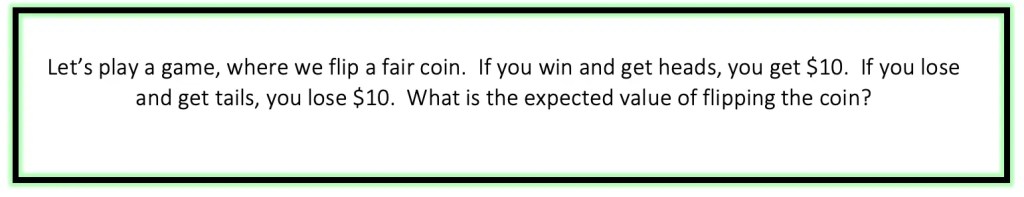
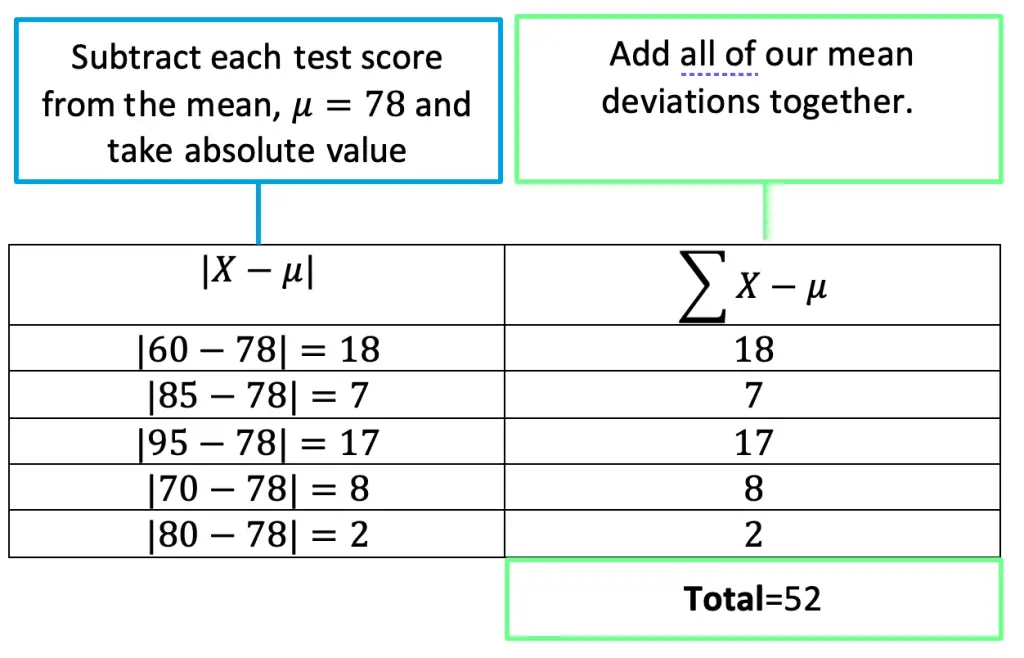
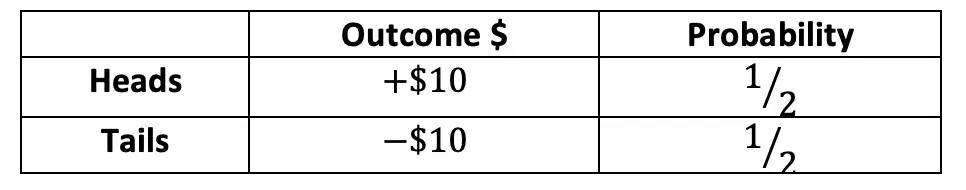
Step 1: First let’s write out all the possible outcomes and related probabilities for flipping a fair coin and playing this game. Making the below table, maps out our Probability Distribution of playing this game.
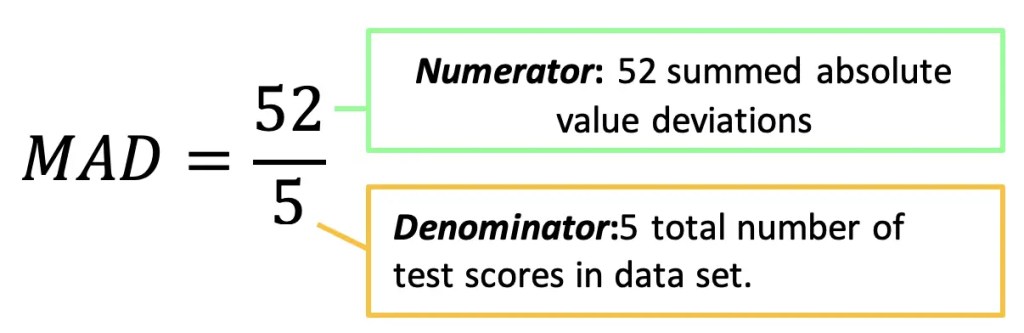
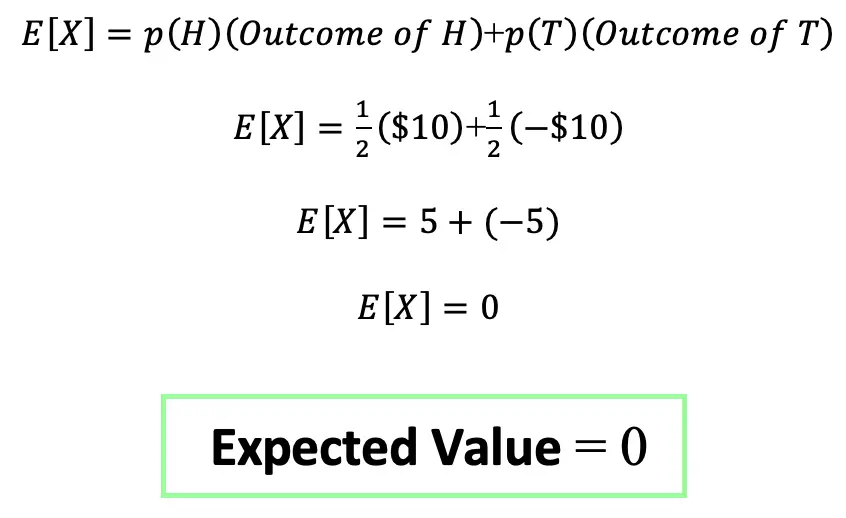
Step 2: Now that, we have written out all numeric outcomes and the probability of each occurring, we can fill in our formula and find the Expected Value of playing this game:
Ready for another? Let’s see what happens in the next example when rolling a die.
Example #2: Expected Value of Rolling a Die

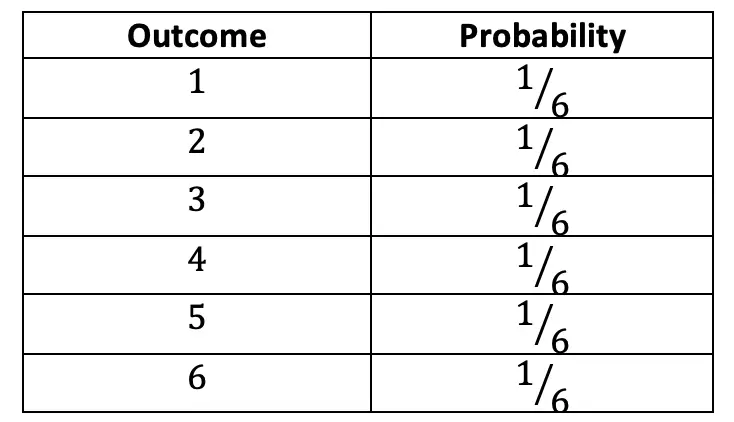
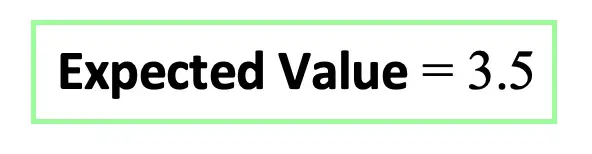
Step 1: First let’s write out all the possible outcomes and related probabilities for rolling a die. In this question, we are assuming that each side of the die takes on its numerical value, meaning rolling a 5 or a 6 is worth more than rolling a 1 or 2. Making the below table, maps out our Probability Distribution of rolling the die.
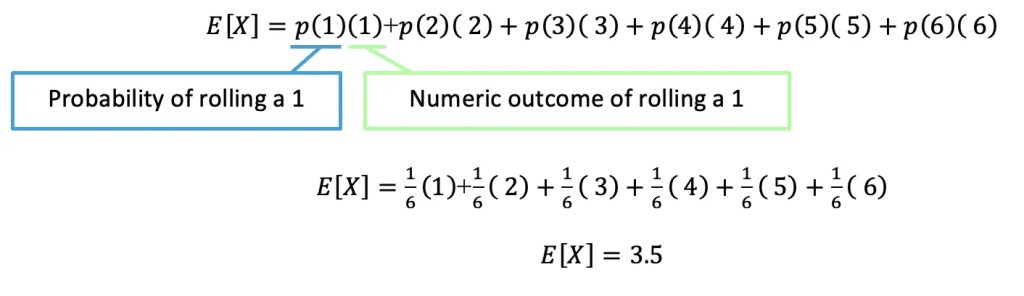
Step 2: Now that, we have written out all numeric outcomes and the probability of each occurring, we can fill in our formula and find the Expected Value of playing this game:
Check out the practice problems below to master your expected value skills!
Practice Questions:
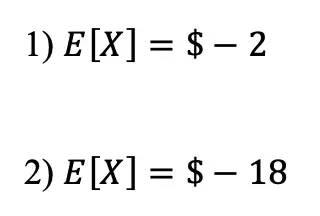
(1) An unfair coin where the probability of getting heads is .4 and the probability of getting tails is .6 is flipped. In a game where you win $10 on heads, and lose $10 on tails, what is the expected value of playing this game?
(2) An unfair coin where the probability of getting heads is .4 and the probability of getting tails is .6 is flipped. In a game where you win $30 on heads, and lose $50 on tails, what is the expected value of playing this game?
Solutions:
Still got questions? No problem! Don’t hesitate to comment with any questions below. Thanks for stopping by and happy calculating! 🙂
Facebook ~ Twitter ~ TikTok ~ Youtube
Looking for something similar to Expected Value? Check out the statistics page here!