Math Jewelry Review: Hanusa Design

Math Jewelry Review Interview

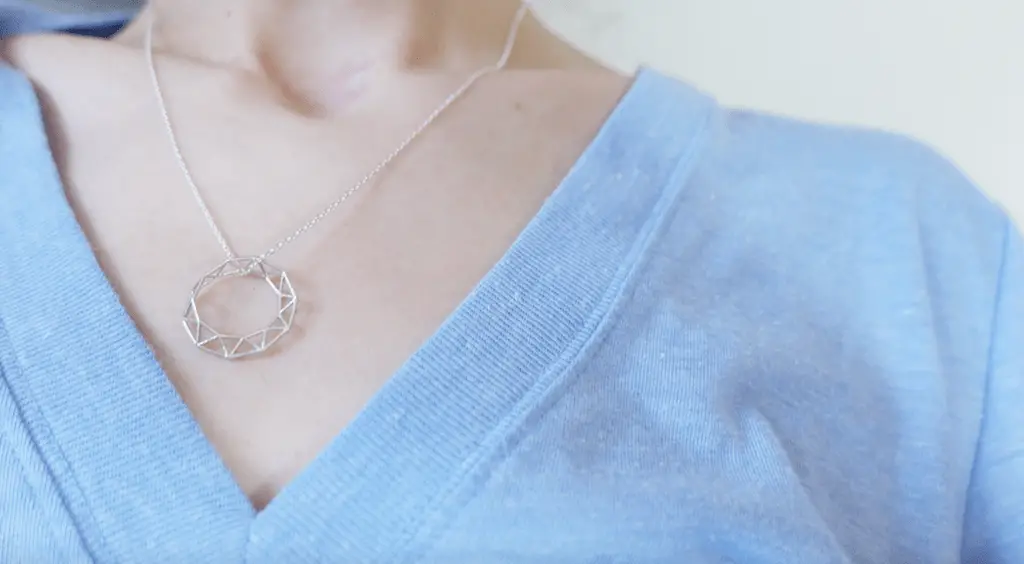
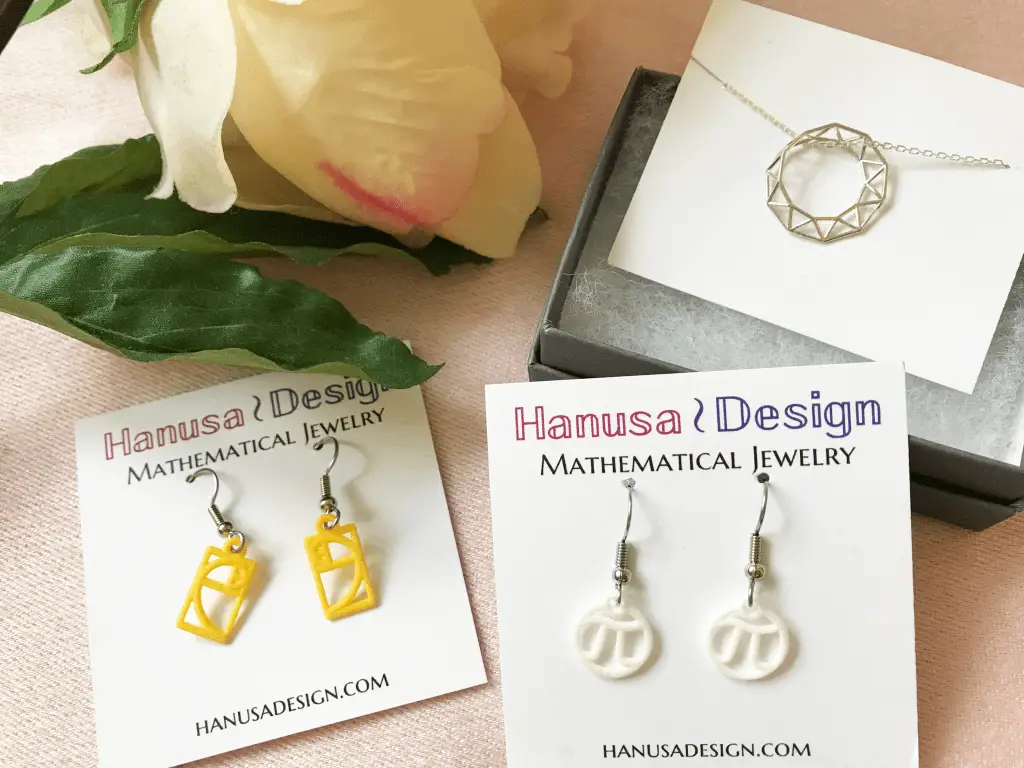
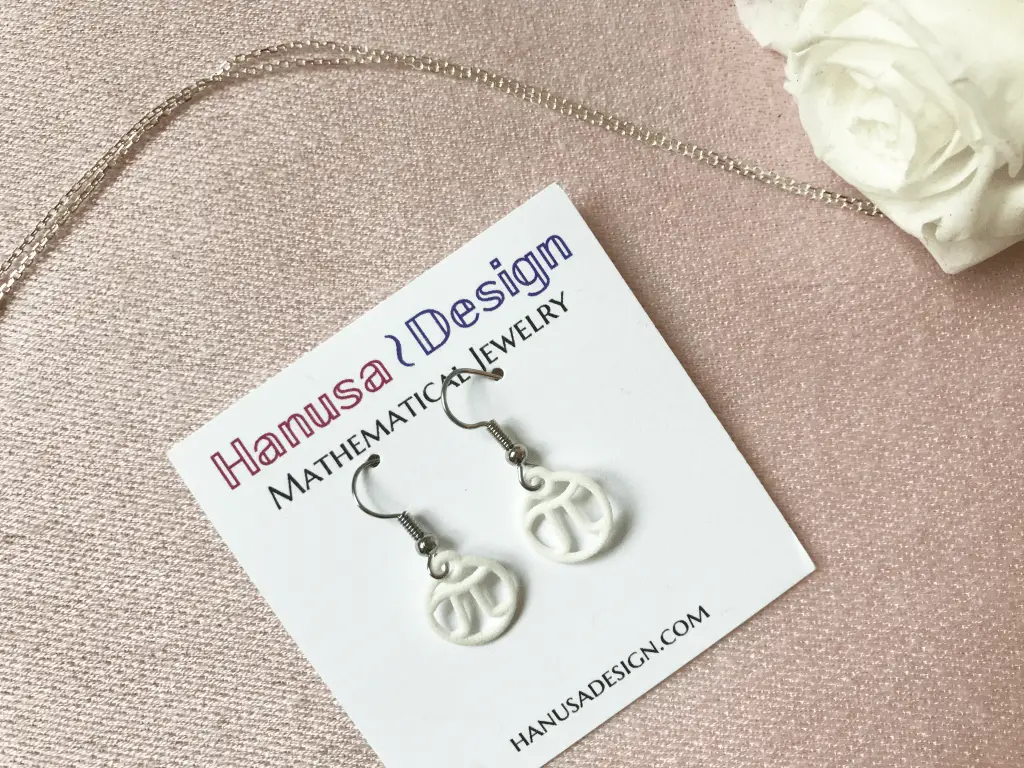
Hi Everyone and welcome to MathSux! I was sent three pieces of math jewelry from the jewelry brand, Hanusa Design. Math jewelry?! What is that?! Each piece you see here was inspired by mathematical art and created using 3D printing. I’m wearing the mobius necklace above and below you’ll also see mini pi and golden ratio earrings. For the full un-boxing and math jewelry review check out the video below and if you’re interested and want to learn more about Hanusa designs and the 3-d printing process, keep reading for the full interview I had with founder, Chirs Hanusa himself in this blog post.

Math Jewelry Review Interview

Math Jewelry Review:

Hanusa Design Interview with Founder, Chris Hanusa:

1.What made you start Hanusa Design? What led you to making jewelry as someone interested in math?

My adventure into 3D printing started in 2015 when I was updating a course in Mathematica I was teaching at Queens College. I was intrigued by 3D printing and I noticed that it was possible to use Mathematica as 3D design software, so I included a 3D design project as part of the class. As my students and I explored 3D printing, I recognized the universal appeal of the beauty and precision of mathematical concepts, and turned these ideas into jewelry. In turn, I founded Hanusa Design in 2017.

2. The jewelry is made through a 3D printing process. Can you explain the process from start to end? Is there a difference between the use of metal vs. nylon?

The design process starts with a mathematical concept that I’ve seen in my research, in mathematical texts, or as “found math” in the real world. I use Mathematica to do the 3D design, using three-dimensional coordinates, parametric functions, and aesthetic choices that turn the idea into a 3D model. The model is then exported directly from Mathematica to an STL file, which is basically a way to represent the boundary of the 3D object as a collection of triangles. The STL files are then sent to a 3D printer.

Once there, the same STL file can be used to create a nylon or metal piece of jewelry. The colorful nylon pieces are created using a SLS (selective laser sintering) process, where a thin layer of nylon powder is spread out and precisely fused to the previous layer using a laser. The excess powder is removed and then I hand dye the models using fabric dye. In contrast, the metal pieces are created using a lost-wax casting process. First, the models are 3D printed in high-resolution wax, then a plaster mold is created around the wax, and then the wax is replaced by molten metal.

3.I saw on your website that you are a mathematician and mathematical artist. Do you teach mathematical art at a university? If so, what types of topics do you cover? What is your favorite form of mathematical art?

I do teach two different courses that involve mathematical art. I teach a class called Mathematical Design that explores art that is created with functions, parametric functions, and polar functions using Desmos. This year I hope to give my Mathematical Design students the opportunity to use the Queens College Makerspace to take their digital art and bring it into reality using a laser cutter, a sewing machine, or a pen plotter. My other class is called Mathematical Computing. In this class I teach my students the computational software Mathematica, including how to use the software to do 3D modeling.  By the end of the semester, the students have designed and 3D printed a mathematical sculpture.

I suppose my favorite type of mathematical art is the visualization of complex mathematical concepts. It’s hard to understand certain concepts, like constructions in the fourth (or higher) dimension. Any picture or sculpture that helps clarify these difficult ideas is important, and it’s even better when it’s created with an eye to the aesthetic. I highly recommend any work by Henry Segerman.

4.I saw on your website that Hanusa Design has been featured in both New York Fashion Week (NYFW) and MoMath.  In what capacity?  Are you being featured in this week’s NYFW Fall 2021?

A wide variety of Hanusa Design jewelry has been available in the gift shop at the National Museum of Mathematics since 2018, including my dangling cubes earrings and interlocking octahedron necklace. I was asked to participate in a New York Fashion Week-adjacent show in Spring 2019 and enjoyed the experience. I am looking forward to eventually participate in New York City Jewelry Week.

5.Where can we find Hanusa Design, in stores or online? 

A variety of museums, galleries, and stores stock Hanusa Design Jewelry. As I mentioned before, it is available at the National Museum of Mathematics in New York, NY. It can also be found at the Exploratorium in San Francisco, CA, the Queens Museum in Queens, NY, Gallery North in Setauket, NY, Because Science in Vienna, VA, and in the Wolfram Store in Champaign, IL.

Hanusa Design Discount:

Hanusa has been kind enough to give MathSux readers an exclusive 10% off discount with the code ‘MATHROCKS’ now through December 31st 2021. I know its a bit early but this would be the perfect gift for the holiday season which is coming around the corner! Check out the full collection on their website here for even more designs and colors!

MathSux Giveaway:

math jewelry review

I’m going to be giving away a pair of pi earrings to one lucky MathSux reader! All you have to do is watch the YouTube video above, subscribe to MathSux, and comment below.

What do you guys think of Hanusa Design? Would you wear mathematical jewelry? What about the 3D printing process? Don’t forget to check out the video above for the full math jewelry review. Let me know what you guys think and happy calculating! 🙂

If you’re looking for more mathematical reviews, check out my review on the NumWorks calculator here.

Facebook ~ Twitter ~ TikTok ~ Youtube

Angle Bisector Definition & Example

Hi everyone and welcome to another fabulous week of MathSux! I bring to you the first construction of the back-to-school season! In this post, we are going to go over the angle bisector definition and example. First, we will define what an angle bisector is, then we’ll take our handy dandy compass and straight edge to construct an angle bisector that will bisect an angle for any size! Check out the video and GIF below for more and happy calculating! 🙂

What is an Angle Bisector?

An Angle Bisector is a line that evenly cuts an angle into two equal halves, creating two equal angles. For example, if we have a 70-degree acute angle and we create an angle bisector this would create two equal angles of 35 degrees each, dividing 70 by 2. Check out how to do this construction step by step with pictures and explanations below.

Angle Bisector Example:

Angle Bisector Definition & Example

Step 1: First, we start by placing the point of our compass on the point of the angle, which in this case is 70 degrees.

Step 2: Next, we are going to draw an arc that intersects both lines that stem from the angle we want to bisect.

Step 3: Now, take the point of our compass to where the lines and arc intersect, and draw an arc towards the center of the angle.

Step 4: Keeping that same distance on our compass, we are going to take the point of your compass and place it on the other point where both the line and arc intersect, and draw another arc towards the center of the angle.

Step 5: Notice we made an intersection!? Where these two arcs intersect, mark a point and using a straight edge or ruler, connect it to the center of the original angle. 

Step 6: We have officially bisected our angle into two equal 35-degree halves, creating an angle bisector!

*Please note that the above example bisects a 70º angle, but this construction method will work for an angle of any size acute or obtuse!🙂

What do you think of the above angle bisector definition & example? Do you use a different method for construction? Let me know in the comments below! 🙂

Constructions and Related Posts:

Looking to construct more than just an angle bisector? Check out these related posts and step-by-step tutorials on geometry constructions below!

Construct an Equilateral Triangle

Perpendicular Line through a Point

Bisect a Line Segment with Perpendicular Bisector

Construct a 45º angle

Altitudes of a Triangle (Acute, Obtuse, Right)

Construct a Square inscribed in a Circle

Best Geometry Tools!

Looking to get the best construction tools? Any compass and straight-edge will do the trick, but personally, I prefer to use my favorite mini math toolbox from Staedler. Stadler has a geometry math set that comes with a mini ruler, compass, protractor, and eraser in a nice travel-sized pack that is perfect for students on the go and for keeping everything organized….did I mention it’s only $7.99 on Amazon?! This is the same set I use for every construction video in this post. Check out the link below and let me know what you think!

Facebook ~ Twitter ~ TikTok ~ Youtube

Looking for more constructions? Check out how to construct a square inscribed in a circle and an equilateral triangle by clicking on their respective links! And if you’re looking for even more geometry constructions, check out the link here!

AnAngle Bisector Definition & Example

How to Find Expected Value

Greeting math friends! Today, we are going to dive into statistics by learning how to find the expected value of a discrete random variable. To do this we will need to know all potential numeric outcomes of a “gamble,” as well as be able to repeat the gamble as many time as we want under the same conditions, without knowing what the outcome will be. But I’m getting ahead of myself, all of this will be explained below with two different examples step by step! Don’t forget to check out the video and practice questions at the end of this post to check your understanding. Happy calculating! 🙂

What is Expected Value?

Expected Value is the weighted average of all possible outcomes of one “game” or “gamble” based on the respective probabilities of each potential outcome.

Expected Value Formula: Don’t freak out because below is the expected value formula.

How to Find Expected Value

In essence, we are multiplying each outcome value by the probability of the outcome occurring, and then adding all possibilities together!  Since we are summing all outcome values times their own probabilities, we can re-write the formula in summation notation:

How to Find Expected Value

Does the above formula look insane to you?  Don’t worry because we will go over two examples below that will hopefully clear things up! Let check them out:

Example #1: Expected Value of Flipping a Coin

Step 1:  First let’s write out all the possible outcomes and related probabilities for flipping a fair coin and playing this game.  Making the below table, maps out our Probability Distribution of playing this game.

How to Find Expected Value

Step 2: Now that, we have written out all numeric outcomes and the probability of each occurring, we can fill in our formula and find the Expected Value of playing this game:

How to Find Expected Value

Ready for another?  Let’s see what happens in the next example when rolling a die.

Example #2: Expected Value of Rolling a Die

Step 1:  First let’s write out all the possible outcomes and related probabilities for rolling a die. In this question, we are assuming that each side of the die takes on its numerical value, meaning rolling a 5 or a 6 is worth more than rolling a 1 or 2.  Making the below table, maps out our Probability Distribution of rolling the die.

How to Find Expected Value

Step 2: Now that, we have written out all numeric outcomes and the probability of each occurring, we can fill in our formula and find the Expected Value of playing this game:

How to Find Expected Value

Check out the practice problems below to master your expected value skills!

Practice Questions:

(1) An unfair coin where the probability of getting heads is .4 and the probability of getting tails is .6 is flipped.  In a game where you win $10 on heads, and lose $10 on tails, what is the expected value of playing this game?

(2) An unfair coin where the probability of getting heads is .4 and the probability of getting tails is .6 is flipped.  In a game where you win $30 on heads, and lose $50 on tails, what is the expected value of playing this game?

Solutions:

Still got questions? No problem! Don’t hesitate to comment with any questions below. Thanks for stopping by and happy calculating! 🙂

Facebook ~ Twitter ~ TikTok ~ Youtube

Looking for something similar to Expected Value? Check out the statistics page here!

Why “MathSux”?

Hi Everyone and welcome to MathSux! Today, I wanted to answer a question I get a lot which is why name your Blog and YouTube channel, “MathSux”? Clearly, I love math, but with the name “MathSux” I wanted to show that it can also be hard and even I can think that it suck sometimes. When we don’t understand something it can be frustrating whether its related to math or really anything! The point is we’ve all gotten frustrated when learning something new at some time, but that’s ok, and that’s exactly what MathSux stands for! 🙂

Check out the video below to hear why I chose the name “MathSux” while doodling math art . I hope you enjoy it and happy calculating! 🙂

Why is it called “MathSux”?

*New lessons will be coming your way starting next Wednesday. Also be on the lookout for Regents review questions up on YouTube tomorrow and Friday! 🙂

If you are a teacher or student, have you ever thought math sucked at some time in your life? Let me know in the comments below!

Facebook ~ Twitter ~ TikTok ~ Youtube

And for more “Just for Fun” math posts and videos, click the link here.

Back to School Review: Algebra | Geometry | Algebra 2/Trig.

Back to School Review

Hey math friends and welcome back to MathSux! Back to school season is upon us which means most students (and teachers) will need to review a bit before diving into a completely new subject.  In order to alleviate some of the back to school whoas, I bring to you, this back to school review! Check out the videos below to get the math juices flowing whether you’re new to Algebra, Geometry, or Algebra 2/Trig! I hope you find these videos helpful and wish everyone the best of luck in their first days at school! Happy calculating! 🙂

How to Prepare for Algebra: 

Calling all incoming algebra students, Combining Like Terms is a great place to start! You most likely have combined like terms before, but there’s nothing like sharpening your skills before getting the intense Algebra questions that are coming your way. Check out the video below and try the practice questions here!

Practice Problems: https://mathsux.org/2020/09/30/algebra-combining-like-terms-and-distributive-property/

How to Prepare for Geometry: 

Geometry students, you have the world of shapes ahead of you! It’s an exciting time to review basic Area, Perimeter, Circumference, and Pythagorean Theorem rules before moving ahead with this subject. Review the Pythagorean Theorem below from Khan Academy and check out the last page of the review sheet here to review area and perimeter.

How to Prepare for Algebra 2:

Relieve the fond memories of algebra by reviewing all the different ways to Factor and Solve Quadratic Equations! This is a great way to prepare for rational expressions and the harder algebra 2 problems that are right around the corner.  Check out the video below and related practice questions here to reinforce these hopefully not yet forgotten algebra skills!

Practice Problems: https://mathsux.org/2020/06/09/algebra-4-ways-to-factor-trinomials/
Practice Problems: https://mathsux.org/2016/07/06/algebra-2-factor-by-grouping/

Hope you find this quick review helpful before diving in for the real deal! Besides brushing up on these math topics, what type of new school year routines do like to practice in your classroom or at home? Let me know in the comments and happy calculating! 🙂

Facebook ~ Twitter ~ TikTok ~ Youtube

Olympics Statistics: Top 10 Medals by Country

Olympics Statistics

Greetings and welcome back to MathSux! This week, in honor of the Tokyo Olympics, I will be breaking down some Olympic Statistics. We will look at the top 10 countries that hold the most medals and then look at the top 10 medals earned by country in relation to each country’s total population. Let’s take a look and see what we find! Also, please note that all data used for this analysis was found on the website, here. Anyone else watching the Olympics? Try downloading the data with the link above and see what type of conclusions you can find! Happy Calculating! 🙂

Top 10 Countries: Total Olympic Medals

Below shows the top 10 total medals earned by country from the beginning of the Olympics in 1896 to present day July 2021. As we can see in the graph below, the United States is way ahead of the game with thousands more Olympic medals when compared to any other country in the entire world! I always knew the U.S. did well in the Olympics, but did not realize it was to this magnitude!

Top 10 Countries: Total Olympic Medals Based on Population

Below is a different kind of graph. This percentage rate represents total medals earned over time from 1896 to July 2021 divided by the country’s total population. In this case, we can see that Lichtenstein has earned way more medals based on their small population size when compared to any other country in the world! This is amazing and unexpected!

Remember that all data for the above graphs were made from the following website, here. Are you surprised by the above graphs and conclusions? Try downloading the data on your own and see what you can conclude using your own Olympics Statistics skills! Happy calculating! 🙂

Looking to apply more math to the real world? Check out how to find volume of the Hudson Yards Vessal in NYC here

Facebook ~ Twitter ~ TikTok ~ Youtube

How to Construct a Perpendicular Line through a Point on the Line

Greetings math peeps and welcome to another week of MathSux! In this post, we will learn how to construct a perpendicular line through a point on the line step by step. In the past, we learned how to bisect a line by constructing a perpendicular bisector right down the middle of a line segment, but in this case, we will learn how to create a perpendicular line through a given point on the line (which is not always in the middle). As always, please follow along with the GIF and step-by-step tutorial below or check out the video. Thanks for stopping by and happy calculating! 🙂

What are Perpendicular Lines?

Perpendicular lines are lines that intersect to create four 90º angles (or right angles) about the two line segments. In the example below, line l is perpendicular to line segment AB, which forms a right angle.

Segment Bisector
Line l is perpendicular to line segment AB

Note! When we construct a Perpendicular Bisector, the line we create forms a 90-degree angle and splits the line segment in half. In the construction below, however, we are creating a perpendicular line through a point already on the line segment. Note that the point given to us, will not always be splitting the line into two equal halves the way a segment bisector does. See for yourself below!

How to Construct a Perpendicular Line through a Point on the Line?:

How to Construct a Perpendicular Line through a Point on the Line Segment

What is happening in this GIF?

Step 1: First, notice we are given line segment AC with point B, not in the middle, but along our line. We are going to need a compass and a straightedge or ruler to complete our construction.

Step 2: Our goal is to make a perpendicular line going through point B that is given on our line segment AC.

Step 3: First, let’s open up our compass to any distance (something preferably short enough to fit around our point and on line segment AC).

Step 4: Place the compass end-point on Point B, and draw a semi-circle around our point, making sure to intersect the given line segment.

Step 5: Next, open up the compass at any size and take the point of the compass to the intersection of our semi-circle and given line segment.  Then swing our compass above line segment AC.

Step 6: Keeping that same length of the compass, go to the other side of our point, where the given line and semi-circle connect.  Swing the compass above the line so it intersects with the arc we made in the previous step.

Step 7: Now we can mark the point of intersection created by these two intersecting arcs we just made and draw a perpendicular line using a straight edge going through Point B and we have created our perpendicular line!

Perpendicular Bisector Theorem:

The Perpendicular Bisector Theorem explains that any point along the perpendicular bisector line we just create is equidistant to each end point of the original line segment (in this case line segment AB).

Therefore, if we were to draw points C,D, and E along the perpendicular bisector, then draw imaginary lines stemming from these points to each end point, we’d get something like the image below:

AC = CB

AD = DB

AE = EB

Line Segment Theorem

Constructions and Related Posts:

Looking to construct more than just a perpendicular bisector? Check out these related posts and step-by-step tutorials on geometry constructions below!

Construct an Equilateral Triangle

Bisect a Line Segment with Segment Bisector

Angle Bisector

Construct a 45º angle

Altitudes of a Triangle (Acute, Obtuse, Right)

Construct a Square inscribed in a Circle

Best Geometry Tools!

Looking to get the best construction tools? Any compass and straight-edge will do the trick, but personally, I prefer to use my favorite mini math toolbox from Staedler. Stadler has a geometry math set that comes with a mini ruler, compass, protractor, and eraser in a nice travel-sized pack that is perfect for students on the go and for keeping everything organized….did I mention it’s only $7.99 on Amazon?! This is the same set I use for every construction video in this post. Check out the link below and let me know what you think!

Still got questions? No problem! Don’t hesitate to comment with any questions below or check out the video above. Thanks for stopping by and happy calculating! 🙂

Facebook ~ Twitter ~ TikTok ~ Youtube

Want to see how to construct a square inscribed in a circle? Or maybe you want to construct an equilateral triangle? Click on each link to view each construction! And if you’re looking for even more geometry constructions, check out the link here!

Origami and Volume of a Box and Square Base Pyramid

Greetings and happy summer math peeps! In honor of the warm weather and lack of school, I thought we’d have a bit of fun with origami and volume! In this post, we will find the volume of a box and the volume of a square base pyramid. We will also be creating each shape by using origami and following along with the video below. For anyone who wants to follow along with paper folding tutorial, please note that we will need one piece of printer paper that is 8.5″ x 11″and one piece of square origami paper that is 8″ x 8″. If you’re interested in more math and art projects check out this link here. Stay cool and happy calculating! 🙂

Volume of Box (or Rectangular Prism):

To get the volume of our origami box (video tutorial above), we are going to multiply the length times the width times the height. All the values and units of measurement were found by measuring the box we made in inches in the video above with 8.5 x 11 inch computer paper.

Origami and Volume
Origami and Volume

Volume of Square Base Pyramid:

Below is a diagram of the square base pyramid we created via paper folding (watch video tutorial above to follow along!). Please note that if you used a different sized paper (other than 8 X 8 inches), you will get a different value for measurements and for volume.

Origami and Volume
Origami and Volume

For step by step instruction, don’t forget to check out the video above to see how to paper fold a box and square base pyramid. I hope this post made math suck just a little bit less and finding volume a bit more fun. Still got questions or want to learn more about Math+ Art? No problem! Don’t hesitate to comment with any questions below. Thanks for stopping by and happy calculating! 🙂

Facebook ~ Twitter ~ TikTok ~ Youtube

For more Math + Art, check out this post on Perspective Drawing here. And for more Volume + Origami, check out this post on how to find the volume of a cube using origami here and below! If you’re looking for more math and crafts, learn how to make a Mobius Band here!

The Original Spirograph: Math + Art

Happy Summer everyone! Now that school is out, I thought we could have a bit of fun with Math and Art! In this post, we will go over how to make a the original spirograph (by hand) step by step using a compass and straight edge. Follow along with the video below or check out the tutorial in pictures in this post. Hope everyone is off to a great summer. Happy calculating! 🙂

What is a Spirograph?

The childhood toy we all know and love was invented by Denys Fisher, a British Engineer in the 1960’s.But the method of creating Spirograph patterns was invented way earlier by engineers and mathematicians in the 1800’s.

The Original Spirograph (by hand):

The Original Spirograph

Step 1: Gather materials, for this drawing, we will need a compass and straight edge.

The Original Spirograph

Step 2: Using our compass, we are going to open it to 7 cm and draw a circle.

The Original Spirograph

Step 3: Next, we are going to open the compass to 1cm, making marks all around the circle, keeping that same distance on the compass.

The Original Spirograph

Step 4: Draw a line connecting two points together (any two points some distance apart will do).

The Original Spirograph

Step 5: Now, we are going to move the straight edge forward by one point each and connect the two points with another line.

The Original Spirograph

Step 6: Continue this pattern of moving the ruler forward by one point and connecting them together all the way around.

Step 7: We have completed our Spirograph drawing! Try different sized circles, points around the circle, colors, and points of connections to create different types of patterns and have fun! 🙂

Spirograph Deluxe Art Set:

Want to try the one and only toy spirograph on your own!? Check out this Deluxe Spirograph set that brings mathematics and art together! Let your artistic creativity run free by experimenting with different-sized spirograph tools and colorful pens! Great for kids or math nerd adults, and easily available at Amazon for $23.99. Let me know what you think if you end up getting a spirograph set or if you already have one!

Still got questions or want to learn more about Math+ Art? No problem! Don’t hesitate to comment with any questions below. Thanks for stopping by and happy calculating! 🙂

Facebook ~ Twitter ~ TikTok ~ Youtube

For more Math + Art, check out this post on Perspective Drawing here. And for another math + art project, check out this post on Mobius Bands!

Dilations: Scale Factor & Points Other than Origin

Hi there and welcome to MathSux! Today we are going to break down dilations; what they are, how to find the scale factor, and how to dilate about a point other than the origin. Dilations are a type of transformation that are a bit different when compared to other types of transformations out there (translations, rotations, reflections). Once a shape is dilated, the length, area, and perimeter of the shape change, keep on reading to see how! And if you’re looking for more transformations, check out these posts on reflections and rotations. Thanks so much for stopping by and happy calculating! 🙂

What are Dilations?

Dilations are a type of transformation in geometry where we take a point, line, or shape and make it bigger or smaller, depending on the Scale Factor.

We always multiply the value of the scale factor by the original shape’s length or coordinate point(s) to get the dilated image of the shape. A scale factor greater than one makes a shape bigger, and a scale factor less than one makes a shape smaller. Let’s take a look at how different values of scale factors affect the dilation below:

Scale Factor >1 Bigger

Scale Factor <1 Smaller

Scale Factor=2

 In the below diagram the original triangle ABC gets dilated by a scale factor of 2.  Notice that the triangle gets bigger, and that each length of the original triangle is multiplied by 2.

Dilations

Scale Factor=1/2

Here, the original triangle ABC gets dilated by a scale factor of 1/2.  Notice that the triangle gets smaller, and that each length of the original triangle is multiplied by 1/2 (or divided by 2).

Dilations

Properties of Dilations:

There are few things that happen when a shape and/or line undergoes a dilation.  Let’s take a look at each property of a dilation below:

1. Angle values remain the same.

2. Parallel and perpendicular lines remain the same.

3. Length, area, and perimeter do not remain the same.

Now that we a bit more familiar with how dilations work, let’s look at some examples on the coordinate plane:

Example #1: Finding the Scale Factor

Step 1: First, let’s look at two corresponding sides of our triangle and measure their length.

Dilations

Step 2: Now, let’s look at the difference between the two lengths and ask ourselves, how did we go from 3 units to 1 unit?

Remember, we are always multiplying the scale factor by the original length values in order to dilate an image. Therefore, we know we must have multiplied the original length by 1/3 to get the new length of 1.

Dilations

When it comes to dilations, there are different types of questions we may be faced with.  In the last question, the triangle dilated was done so about the origin, but this won’t always be the case.  Let’s see how to dilate a point about a point other than the origin with this next example.

Example #2: Dilating about a Point other than the Origin

Dilations

Step 1: First, let’s look at our point of dilation, notice it is not at the origin! In this question, we are dilating about point m!  To understand where our triangle is in relation to point m, let’s draw a new x and y axes originating from this point in blue below.

Dilations

Step 2: Now, let’s look at coordinate point K, in relation to our new axes.

Step 3: Let’s use the scale factor of 2 and the transformation rule for dilation, to find the value of its new coordinate point. Remember, in order to perform a dilation, we multiply each coordinate point by the scale factor.

Step 4: Finally, let’s graph the dilated image of coordinate point K. Remember we are graphing the point (6,4) in relation to the x and y-axis that stems from point m.

Dilations

Check out these dilation questions below!

Practice Questions:

1) Plot the image of Point Z under a dilation about the origin by a scale factor of 2.

2) Triangle DEF is the image of triangle ABC after a dilation about the origin. What is the scale factor of the dilation?

Dilations

3) Point L is dilated by a scale factor of 2 about point r. Draw the dilated image of point L.

Dilations

4) Line DE is the dilated image of line AB. What is the scale factor of the dilation?

Solutions:

Still got questions? No problem! Don’t hesitate to comment with any questions below. Thanks for stopping by and happy calculating! 🙂

Facebook ~ Twitter ~ TikTok ~ Youtube

Looking for more Transformations? Check out the related posts below!

Translations

Rotations

Reflections