Happy Wednesday math friends! In this post we are going to look at transversals and parallel lines and find the oh so many congruent and supplementary angles they form when they come together! Congruent angles that form with these types of lines are more commonly known as Alternate Interior Angles, Alternate Exterior Angles, Corresponding angles, and Supplementary angles. Let’s look at this one step at a time:
What are Transversals and Parallel Lines?
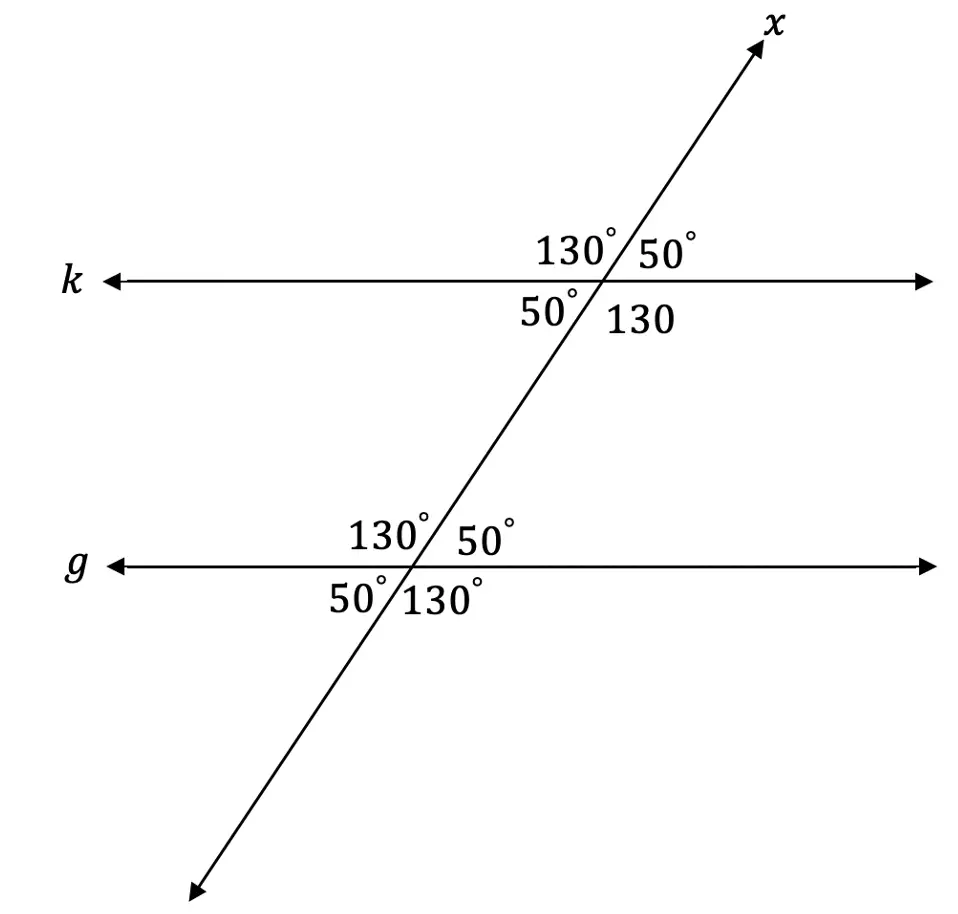
When two parallel lines are cut by a diagonal line ( called a transversal) it looks something like this:
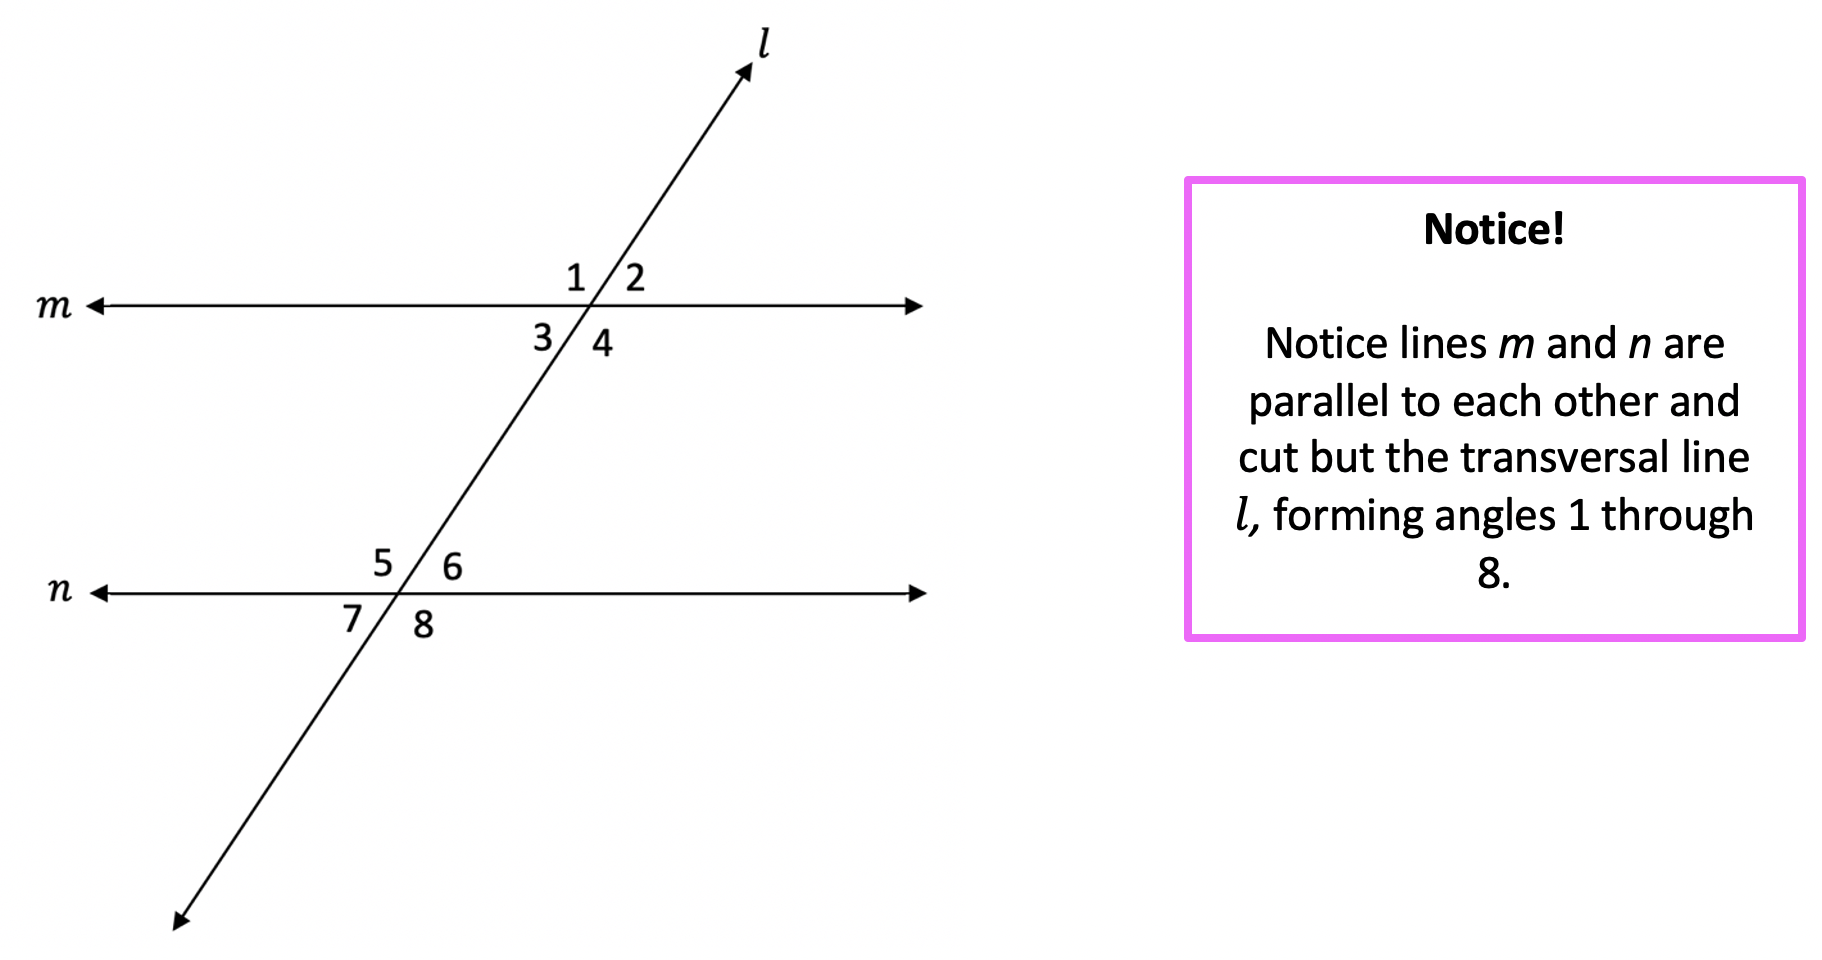
Each angle above has at least one congruent counterpart. There are several different types of congruent relationships that happen when a transversal cuts two parallel lines and we are going to break each down:
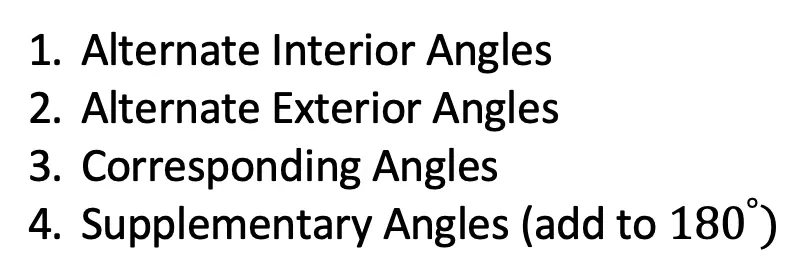
1) Alternate Interior Angles:
When a transversal line cuts across two parallel lines, opposite interior angles are congruent.
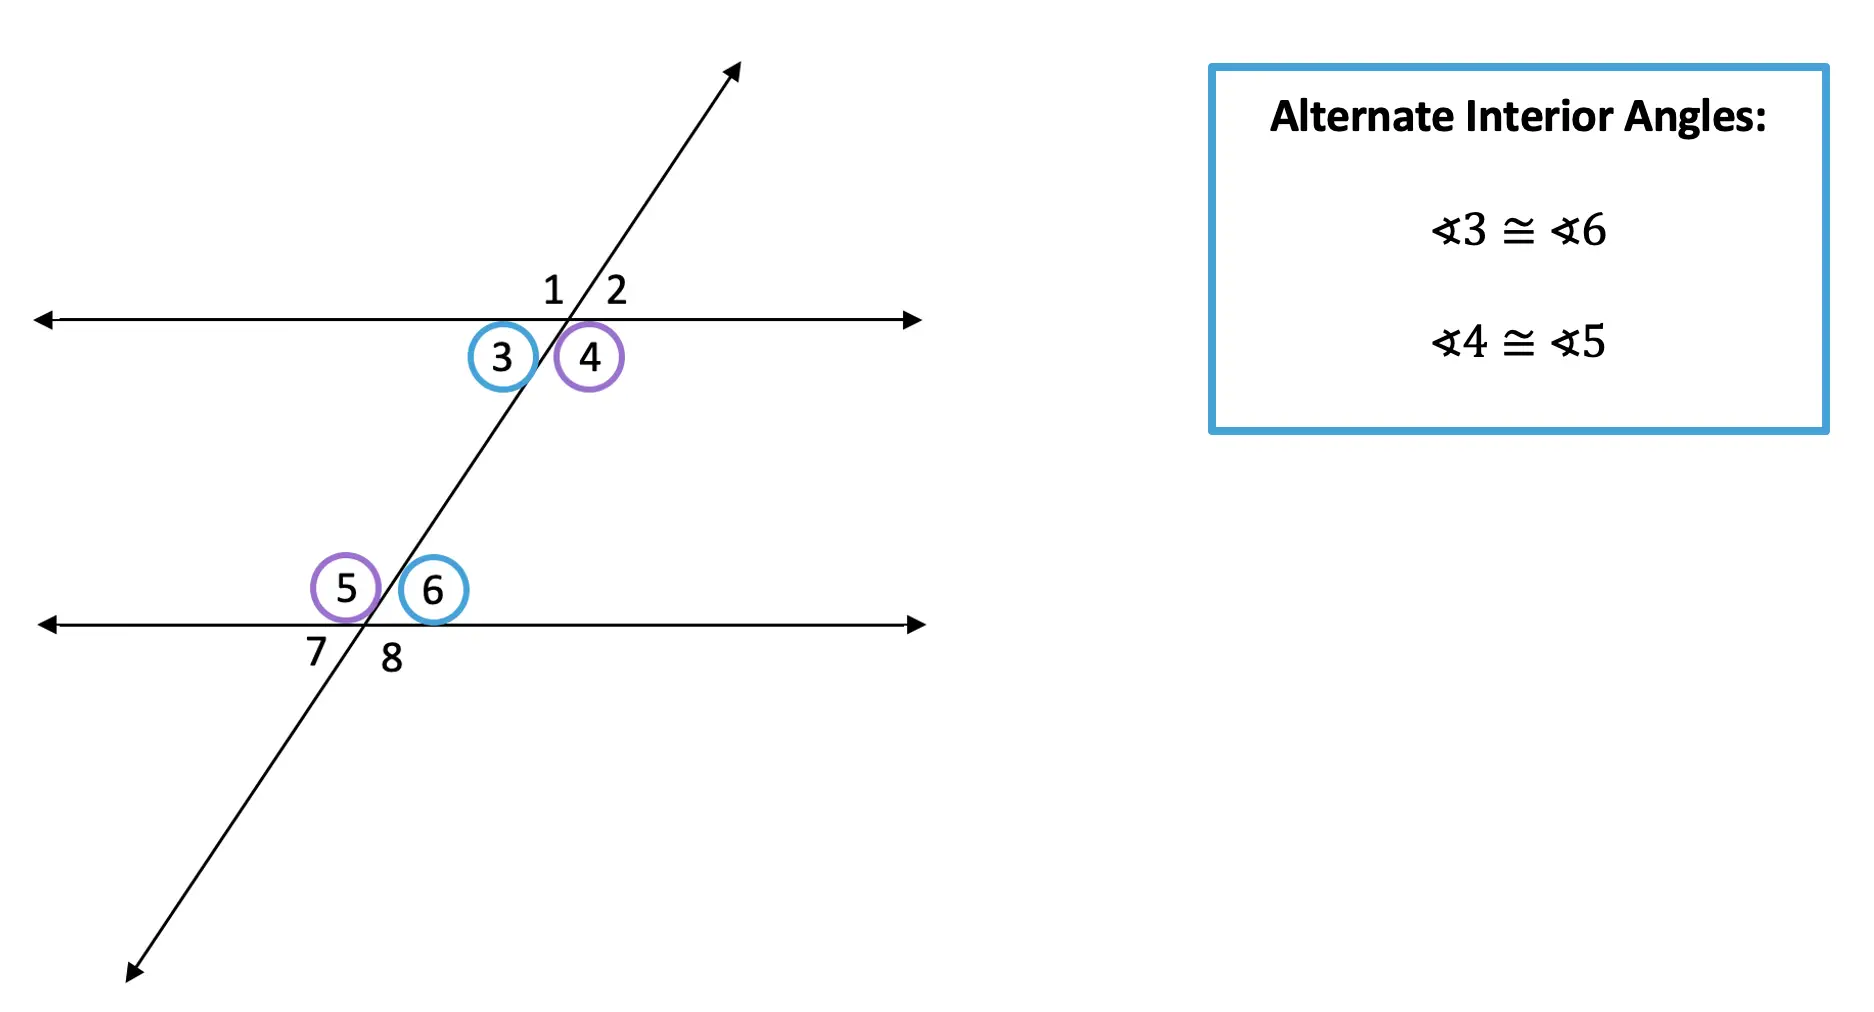
2) Alternate Exterior Angles:
When a transversal line cuts across two parallel lines, opposite exterior angles are congruent.
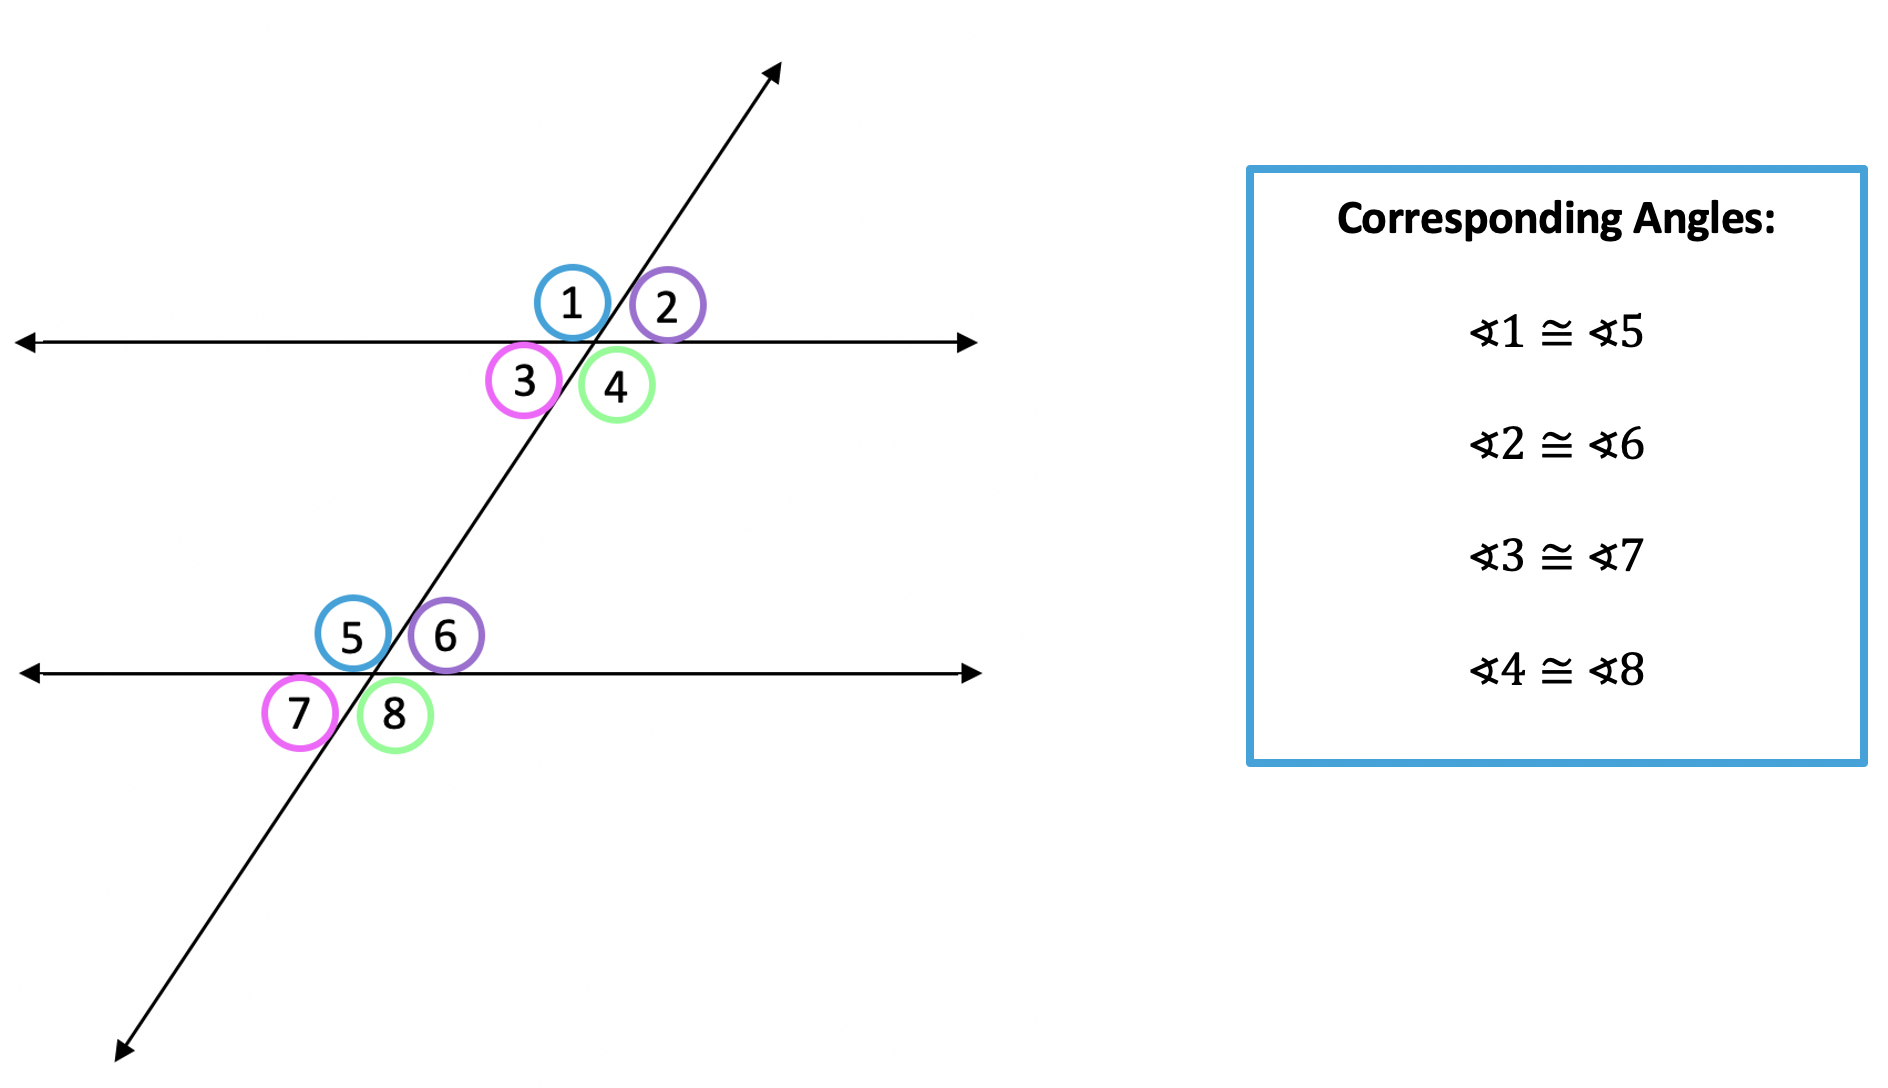
3) Corresponding Angles:
When a transversal line cuts across two parallel lines, corresponding angles are congruent.
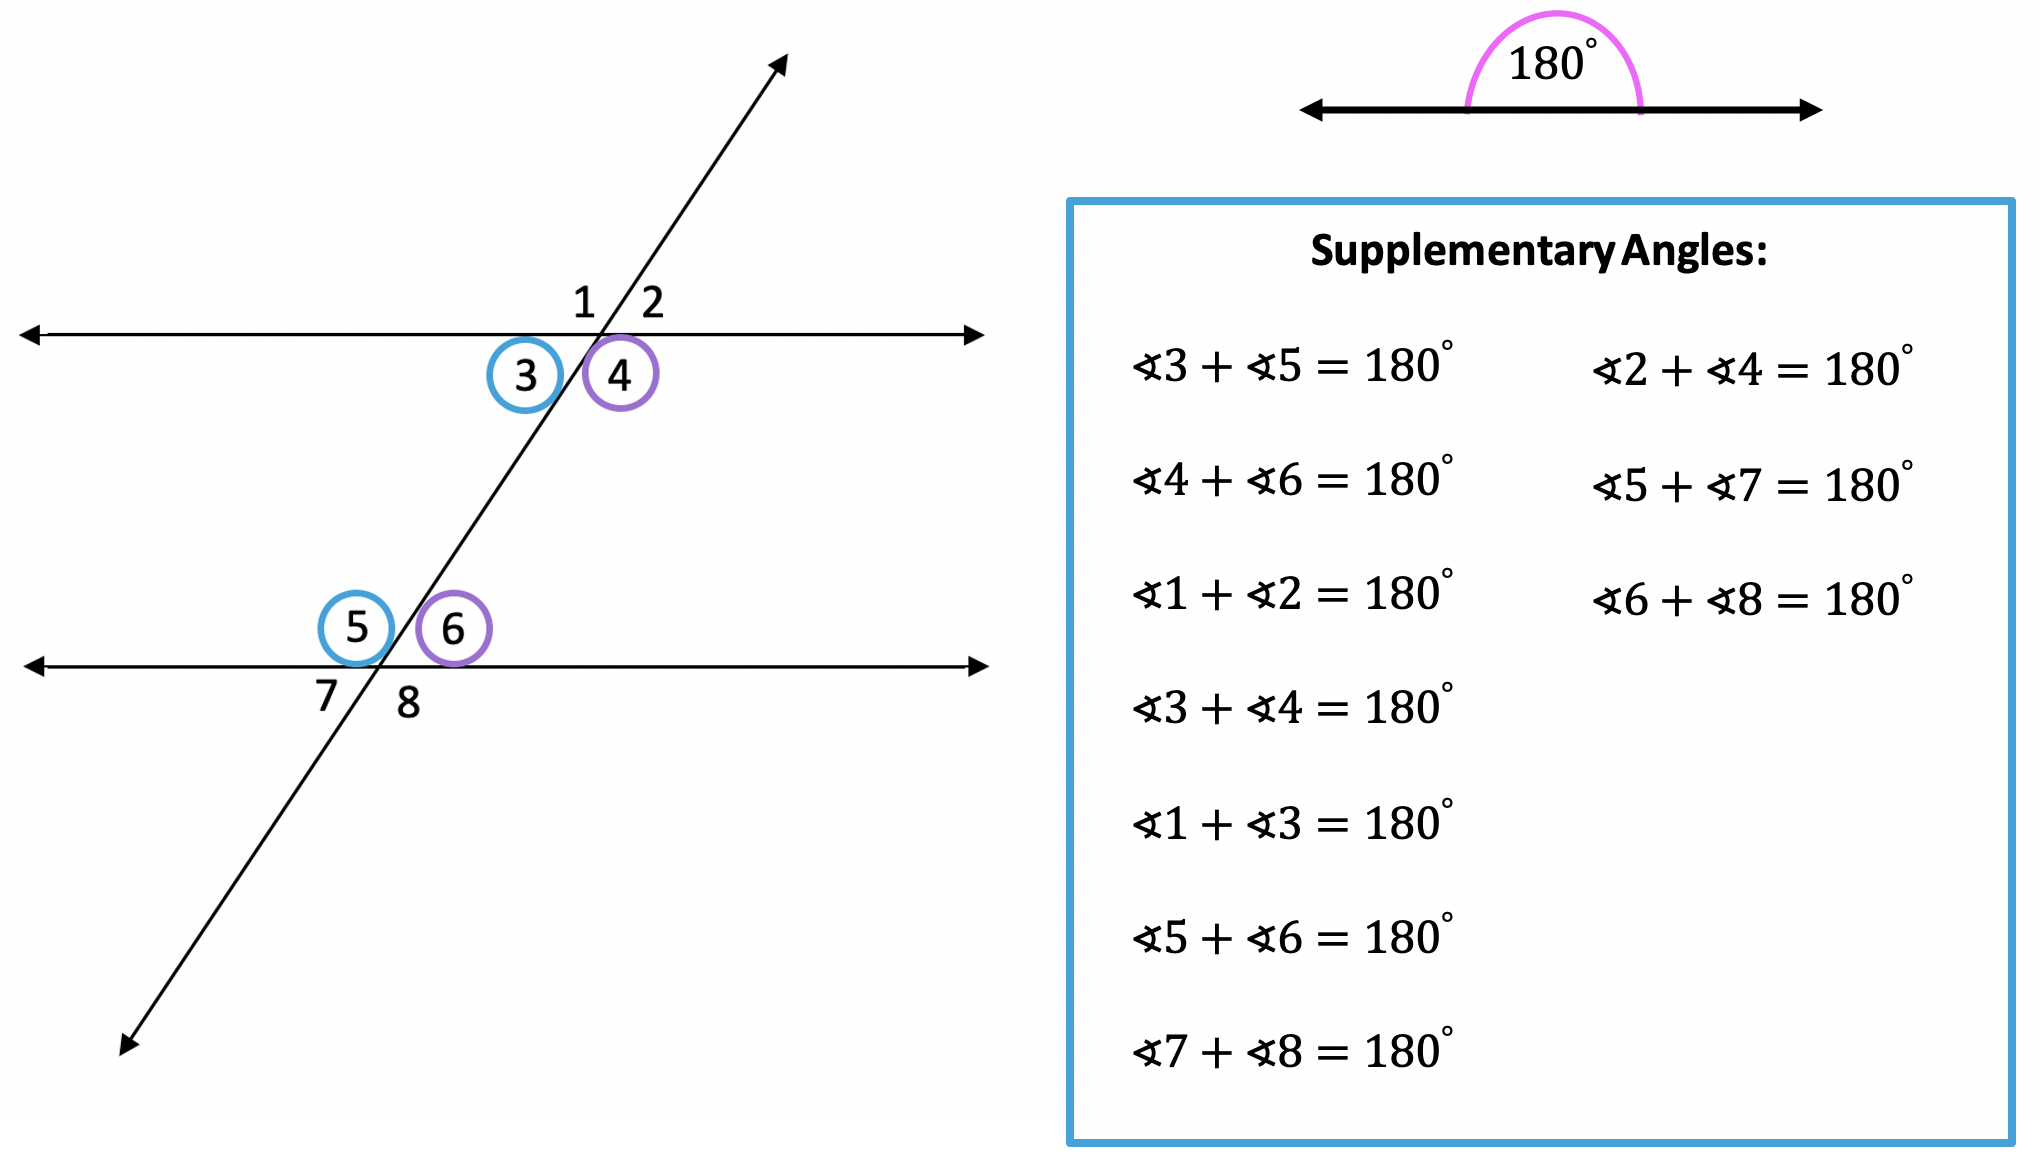
4) Supplementary Angles:
Supplementary angles are a pair of angles that add to 180 degrees. 180 degrees is the value of distance found within a straight line, which is why you’ll find so many supplementary angles below:
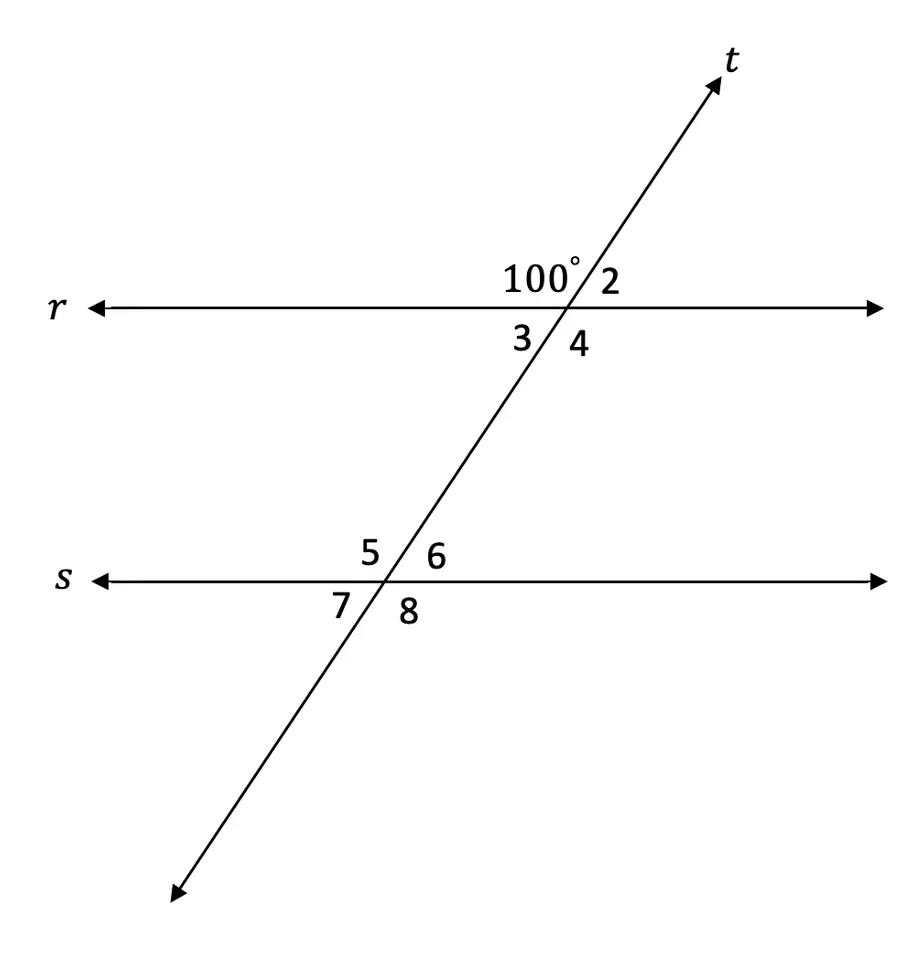
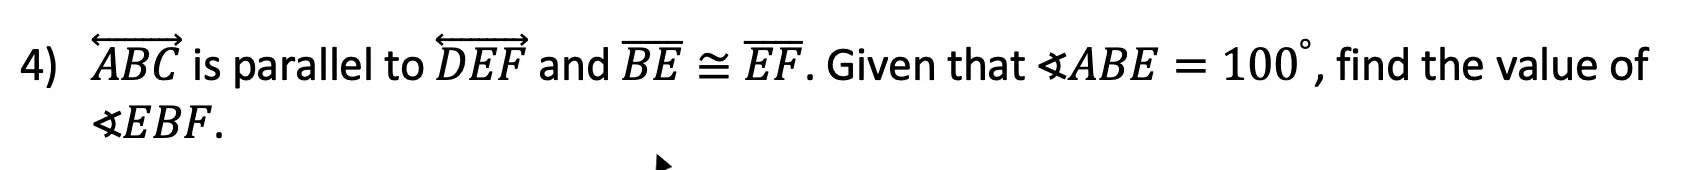
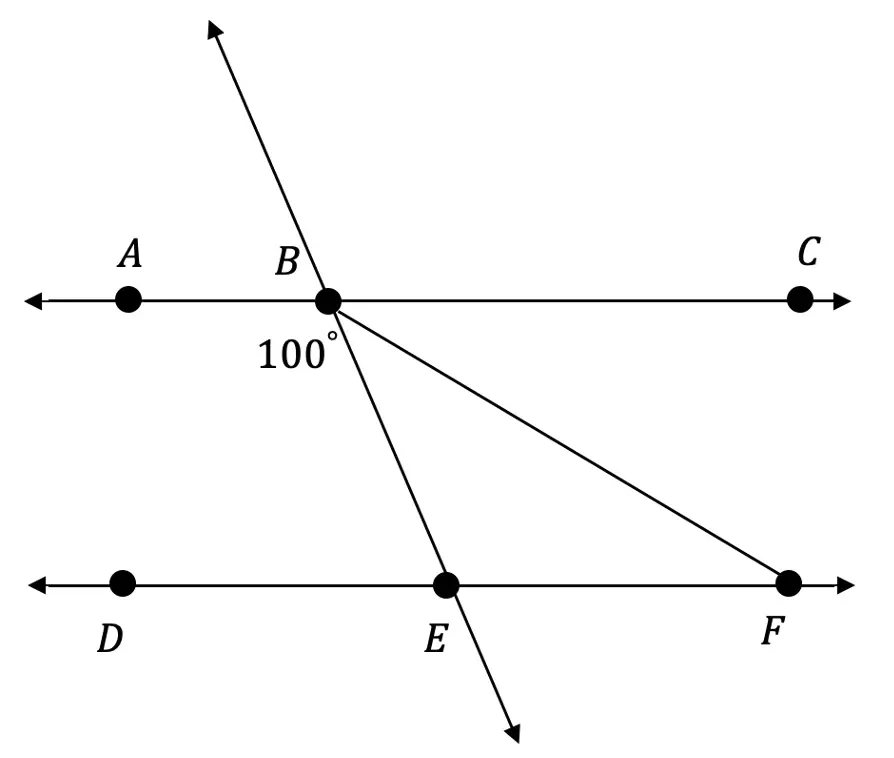
Knowing the different sets of congruent and supplementary angles, we can easily find any missing angle values when faced with the following question:
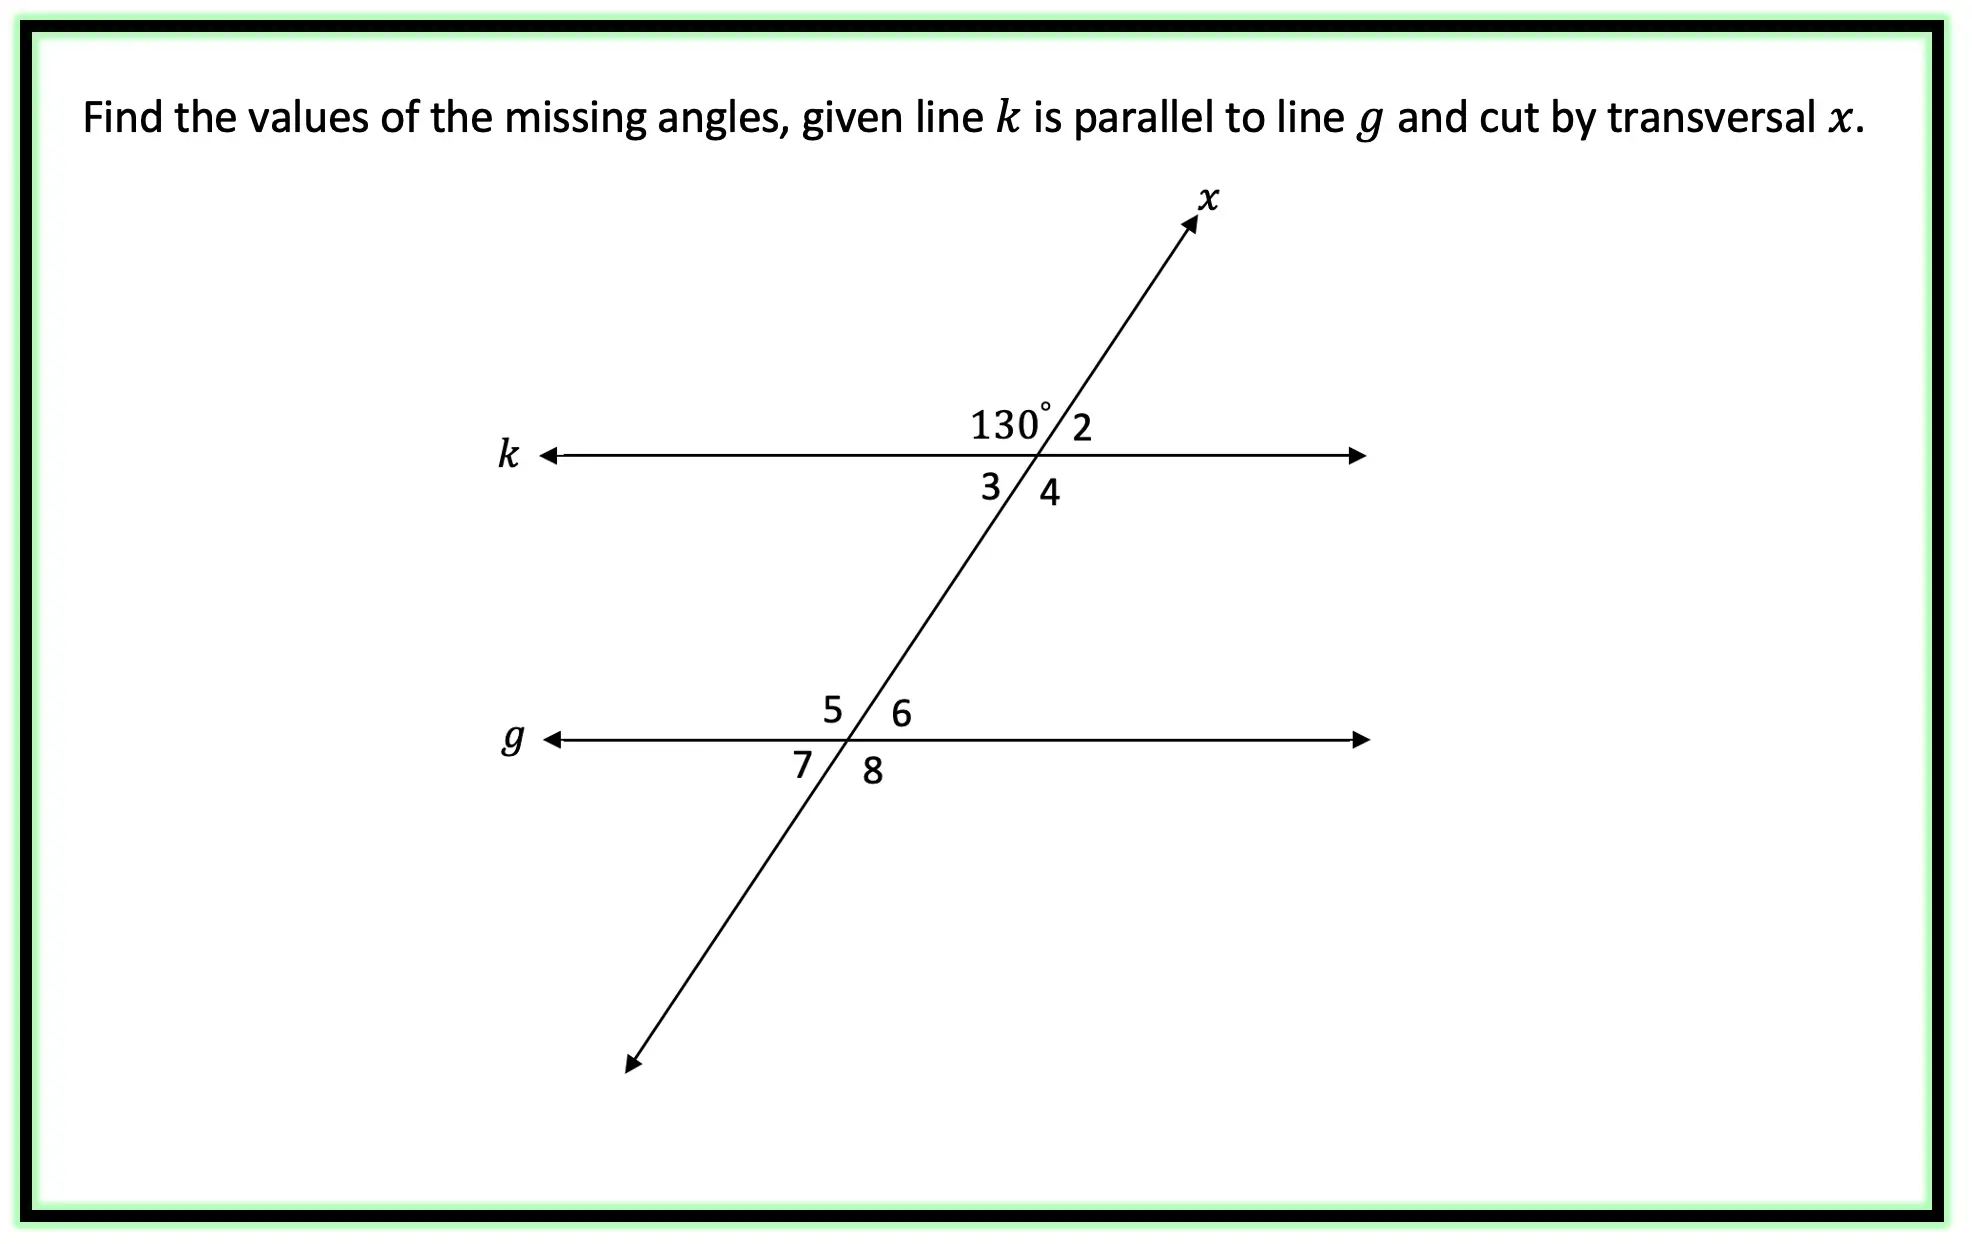
-> Using our knowledge of congruent and supplementary angles we should be able to figure this out! Right away we can find angle 2 by noticing angle 1 and angle 2 are supplementary angles (add to 180 degrees).
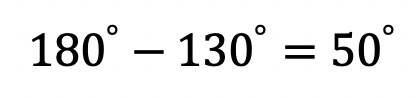
-> Knowing angle 2 is 50 degrees, we can now fill in the rest of our transversal angles based on our corresponding and supplementary rules.
Try the following transversal and parallel lines questions below! Some may a bit harder than the previous example, if you get stuck, check out the video that goes over a similar example above and happy calculating! 🙂
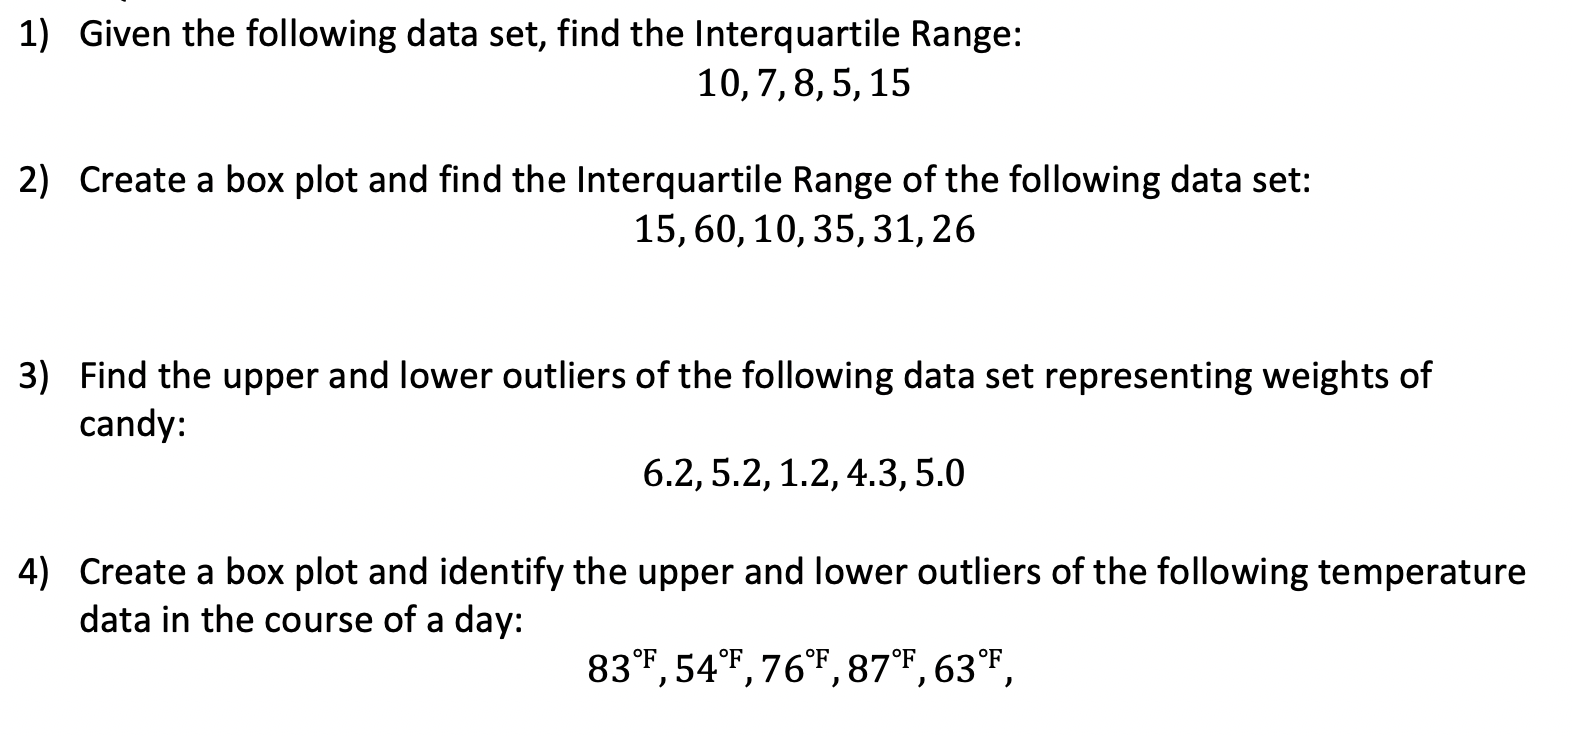
Practice Questions:
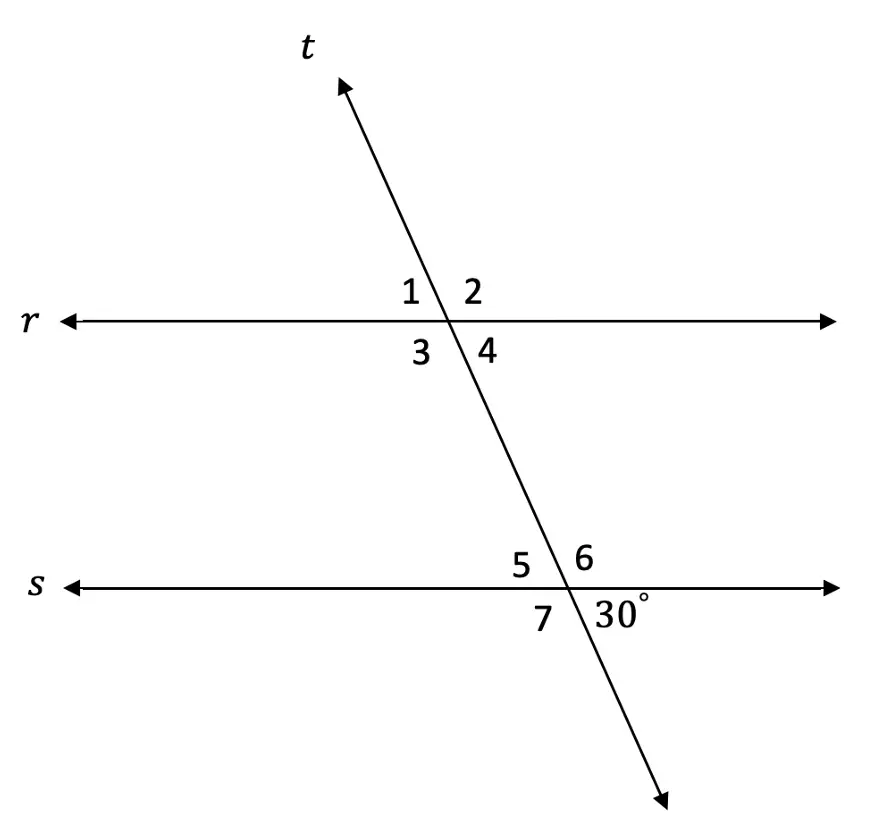
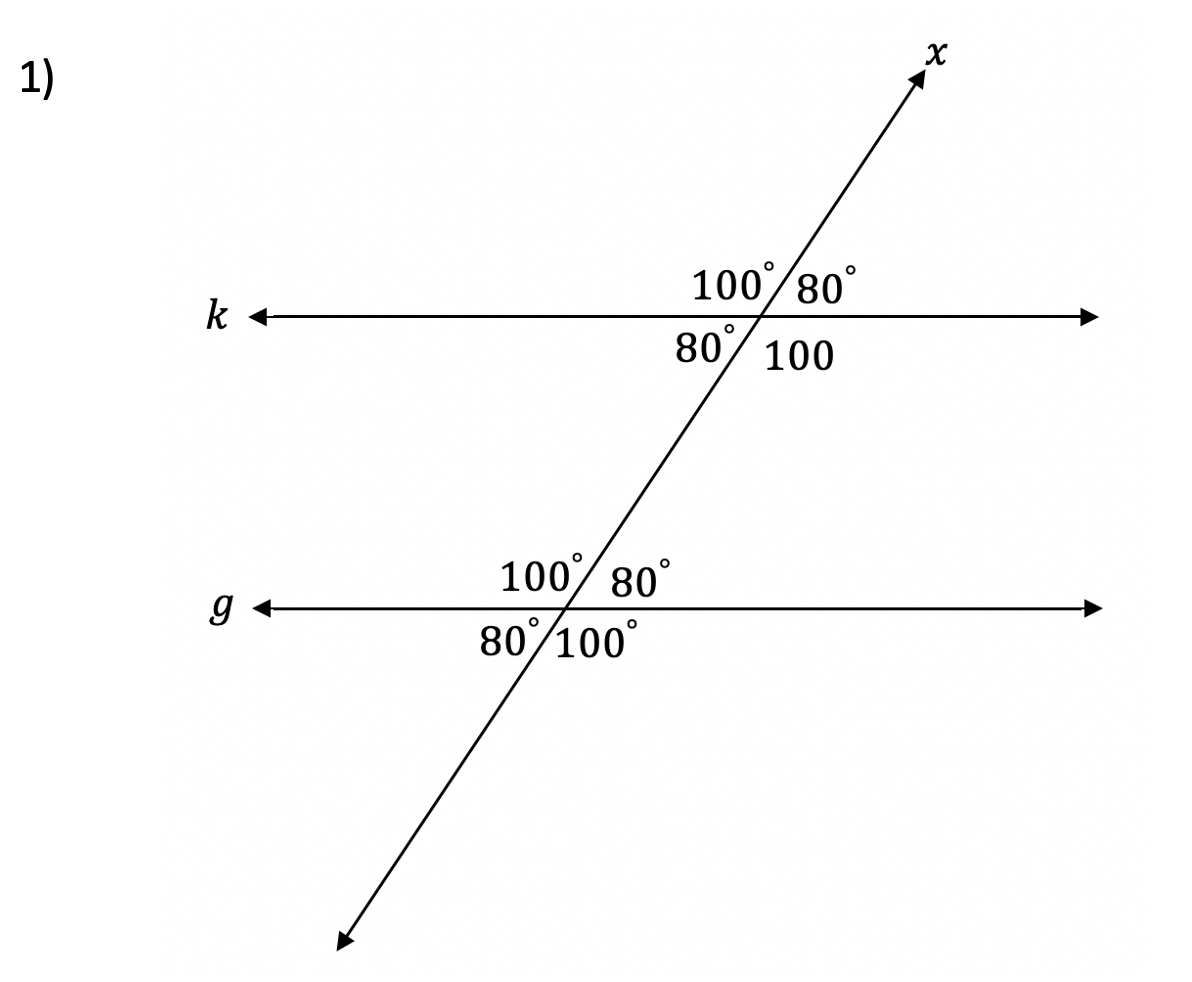
- Find the value of the missing angles given line r
is parallel to line
s and line t is a transversal.
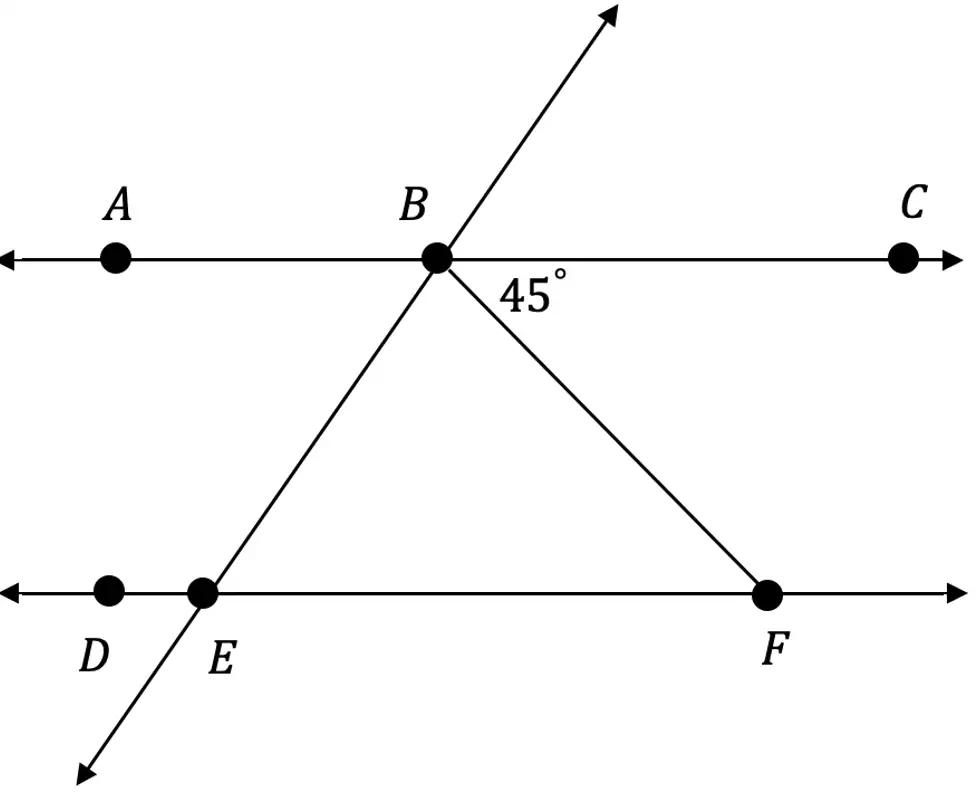
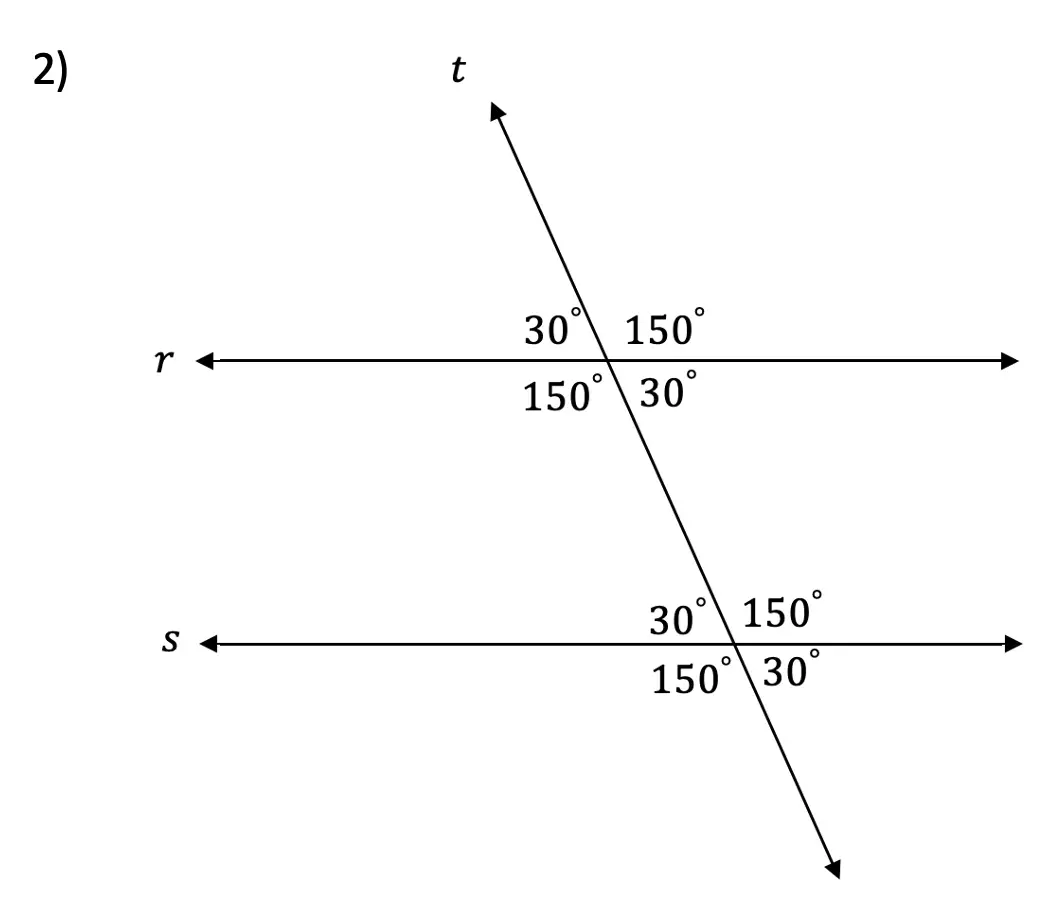
2. Find the value of the missing angles given line r is parallel to line
s and line t is a transversal.

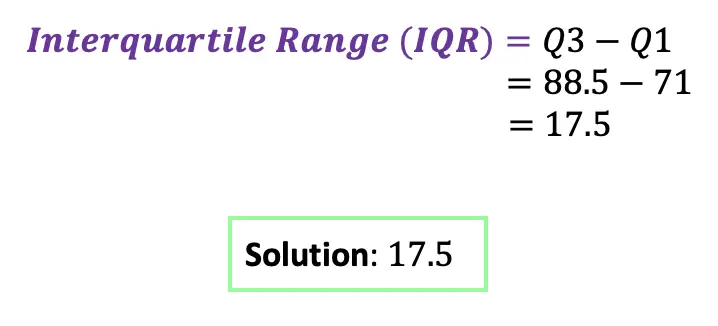
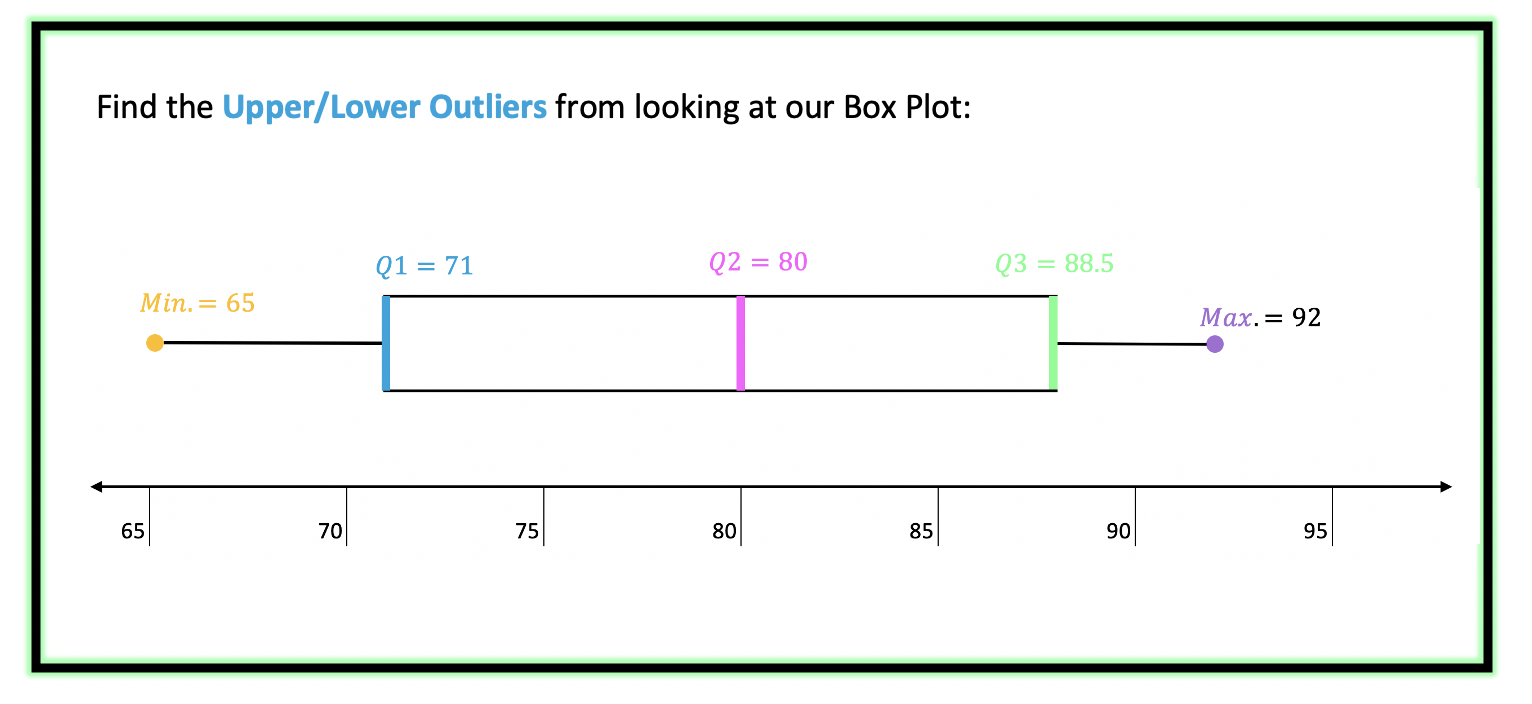
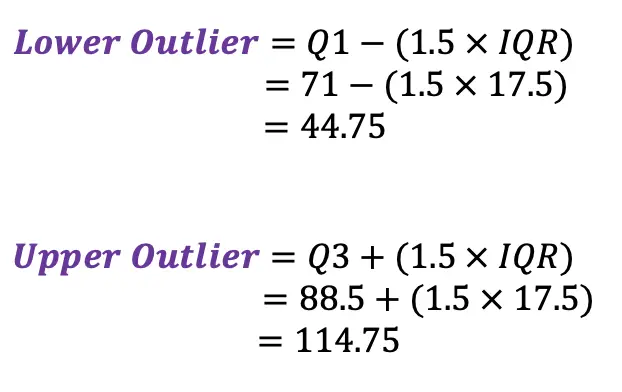
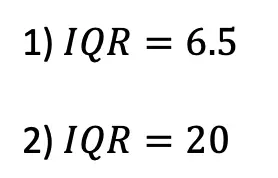
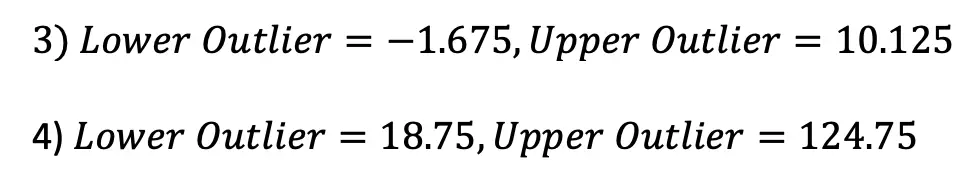
Solutions:
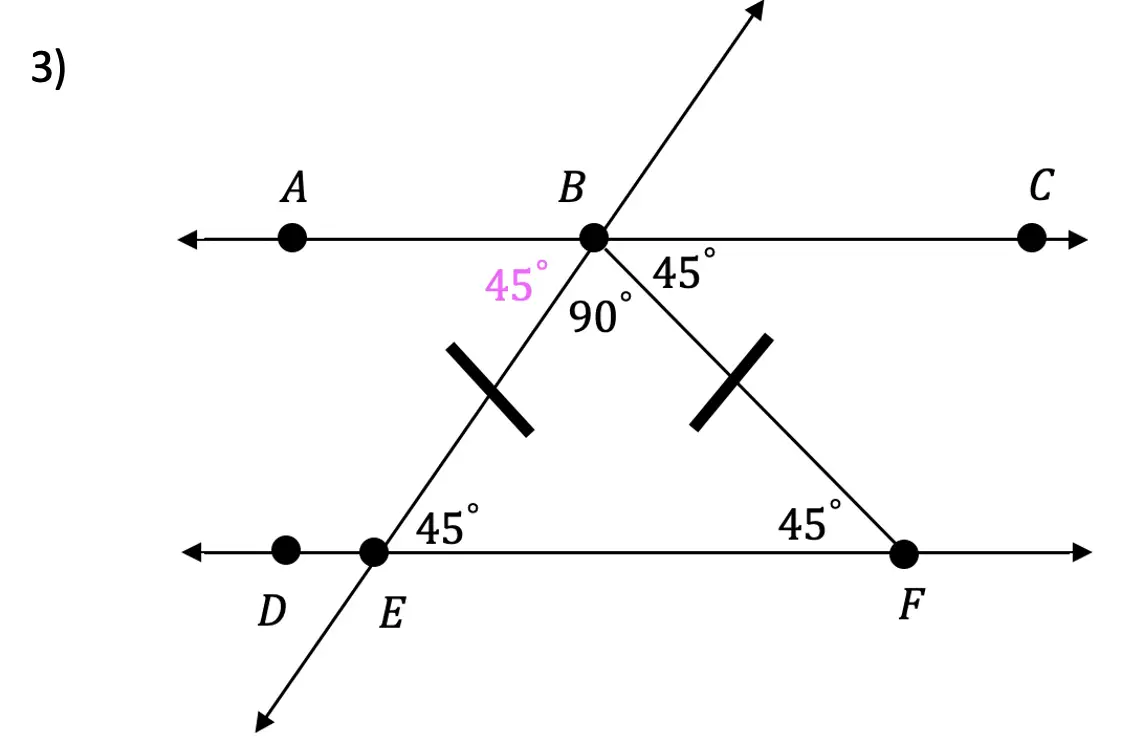
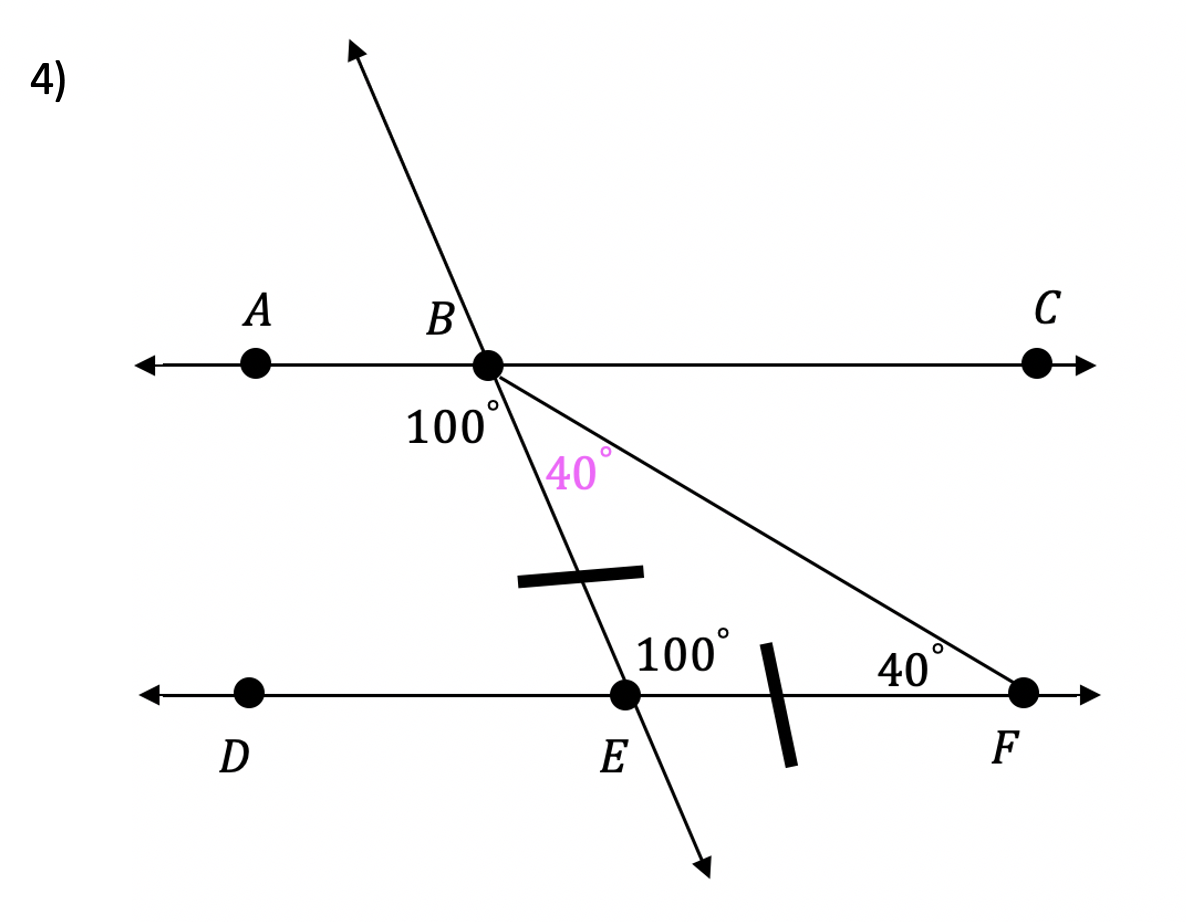
Still got questions? No problem! Don’t hesitate to comment with any questions or check out the video above. Happy calculating! 🙂
Facebook ~ Twitter ~ TikTok ~ Youtube
Also, if you’re looking to learn about the difference between parallel and perpendicular lines, check out this post here!