Hey there math peeps and welcome to MathSux! In today’s post we are going to cover factor by grouping examples, a surprisingly cool and easy factoring method used to factor quadratic equations when “a” is greater than one. It can also be used to factor four term polynomials. We are going to look at an example of each below. If you have any questions, please don’t hesitate to check out the video and try the practice problems at the end of this post. Thanks for stopping by and happy calculating! 🙂
What is Factor by Grouping?
Factor by Grouping is a factoring method that groups common factors of an algebraic expression together. Many times, we use factoring to find the x-values of a quadratic equation when the coefficient “a” is greater than 1.
When should we use Factor by Grouping?
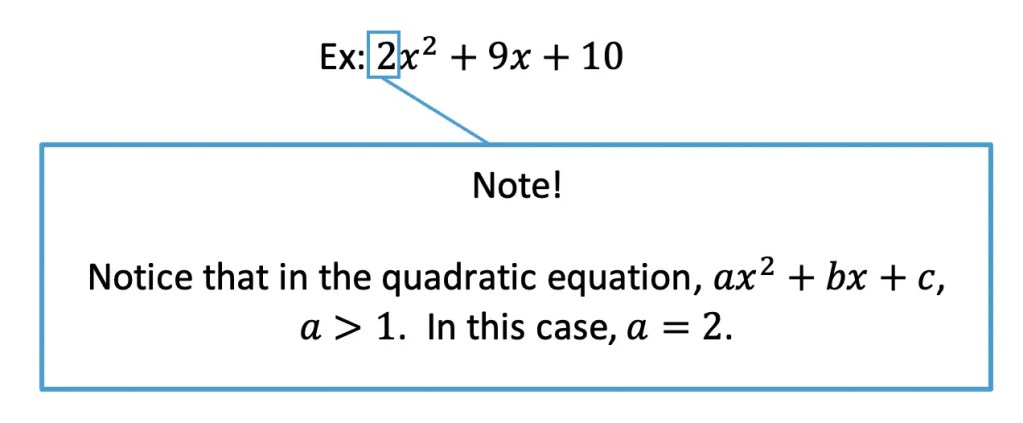
1) If the first coefficient in a quadratic equation, a, is greater than 1:
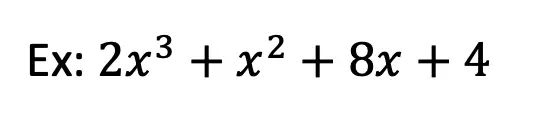
2) When there is a polynomial with 4 terms:
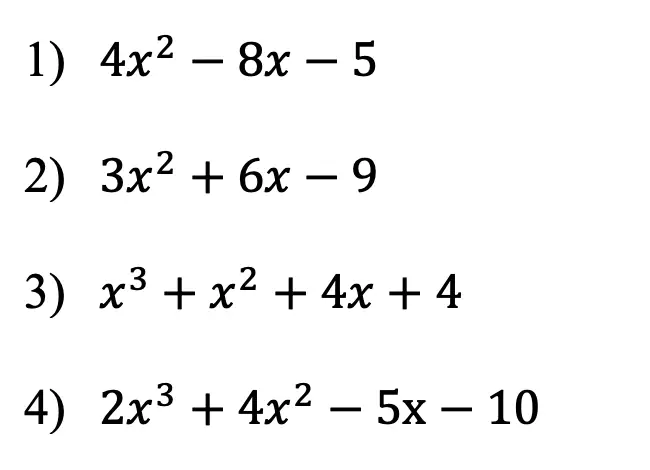
Factor by Grouping Examples:
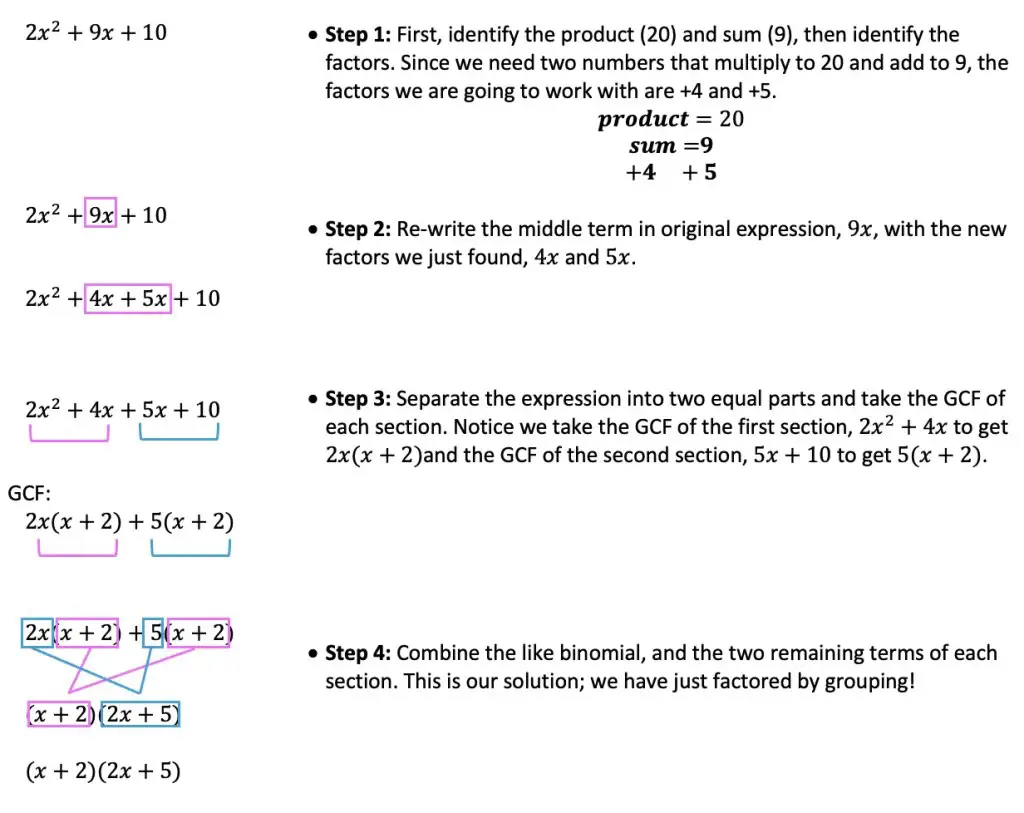
Ready for an Example? Let us look at how to factor a quadratic equation when a is greater than one.
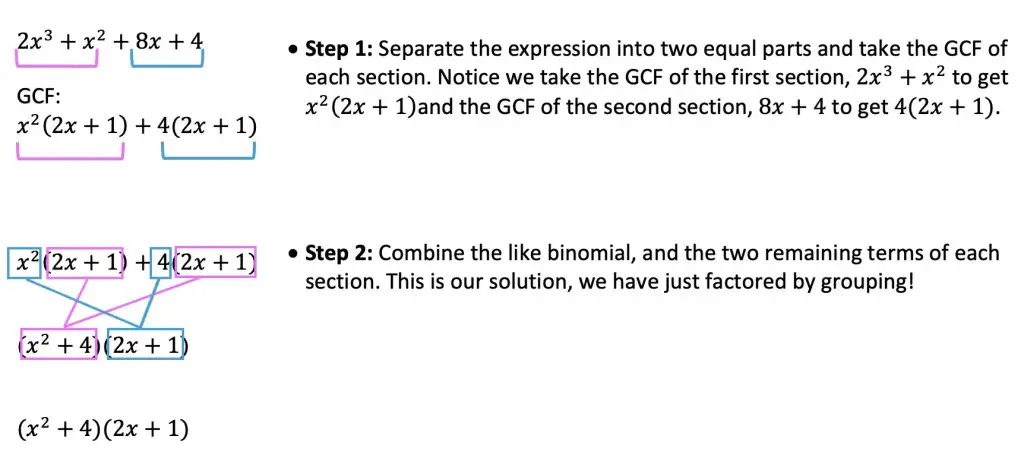
Now, let’s take a look at another type of example, that can be solved with the help of factor by grouping!
Notice that this question is actually easier to solve than the last! The polynomial above, is already split into 4 terms, therefore, we can jump ahead, skipping the product/sum steps we did in the previous example!
Ready to try practice questions on your own? Check them out below to master Factor by Grouping!
Practice Questions:
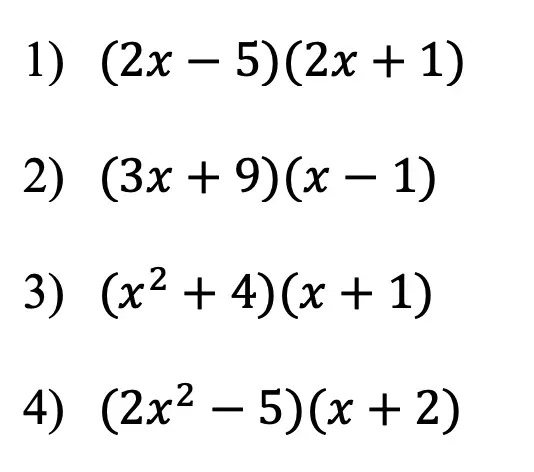
Solutions:
Still got questions? No problem! Don’t hesitate to comment with any questions below. Thanks for stopping by and happy calculating! 🙂
Greetings math friends! Today’s post is for the New York state teachers out there in need of a lesson boost. In this post, we’ll go over what MathSux has to offer for free high school math resources including videos, lessons, practice questions, etc. Remember everything you see here is 100% free and designed to make your life (and your students’ life) easier.
Signing up with MathSux will get you access to FREE:
Everything designed here aligns with the NYS Common Core Standards for Algebra, Geometry, Algebra 2/Trig. and Statistics.
I am a NYS math teacher that creates free math videos, lessons, and practice questions every week, right here, for you! On the YouTube channel, you’ll also find NYSCommon Core Regents questions reviewed one question at a time.
Featured on Google Classrooms around the world, MathSux.org is a great resource especially now, in the time of COVID and zooming and schooling from home. I hope you stick around and find these resources helpful.
And if you’re looking to get the latest MathSux.org videos and emails straight to your inbox, don’t forget to sign up on the right hand-side of the website. Thanks so much for stopping by and happy calculating! 🙂
Hi everyone and welcome to MathSux! Today we will be looking at the difference between Bar Graphs and Histograms. Bar Graphs are something we are already familiar with but now we have histograms, a type of graph that looks somewhat similar. How and why are we using histograms? All questions will be answered in this post! Don’t forget to check your skills with the video and practice questions below. Thanks for stopping by and happy calculating! 🙂
What is the difference between Bar Graphs and Histograms?
Both a bar graph and a histogram allow us to easily visualize a data set that would otherwise just look like a bunch of numbers. By using a bar graph or histogram, we can more easily look at data, analyze it, and even come to conclusions and make decisions which why they are so useful! Nothing like a good graph to make cloudy data seem crystal clear!
Below we will look at the same exact data represented in bar graph form and in histogram form. At a quick glance, what similarities and differences do you notice? Read on for more!
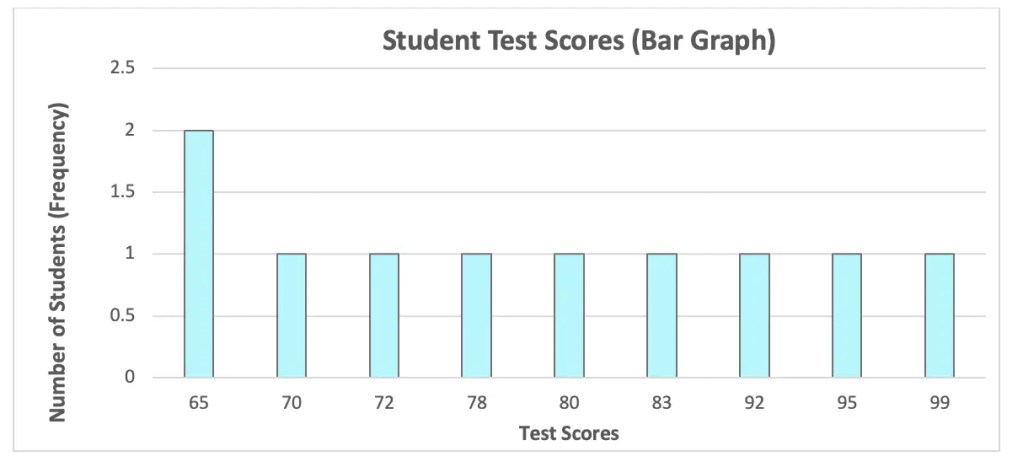
Bar Graph: Simple and to the point, bar graphs measure out the number of times something occurs. Best used for small groups of data, also, note that each bar on the graph has spaces between.
Ex:
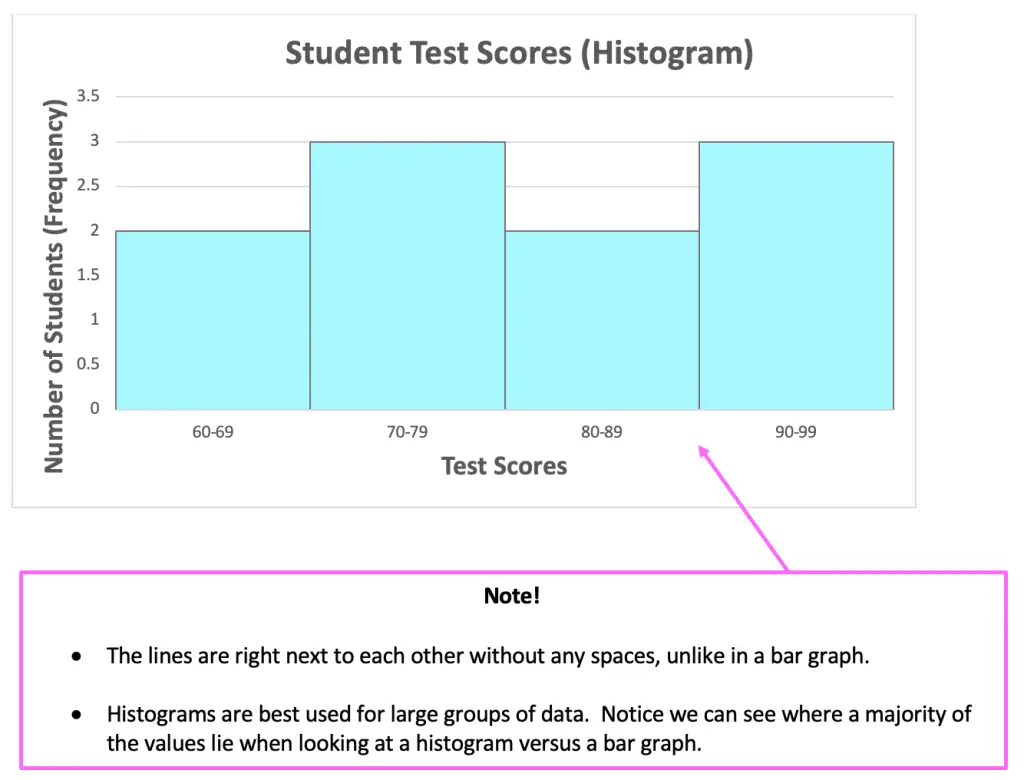
Histogram: Numerical data gets grouped together in something called a frequency table. The data is then graphed based on the number of times something occurs within that interval. Best used for larger groups of data, also note that each interval is represented with bars without spaces in between them.
Ex: *The example below shows the same exact data shown in the bar graph above, but now in the format of a histogram.
Now, let’s check out an Example to see how to make a histogram step by step:
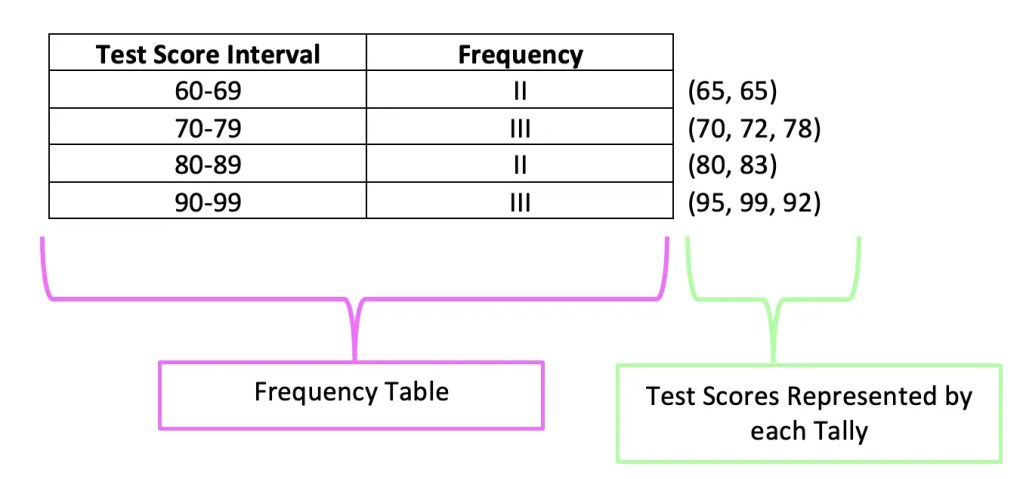
Step 1: First, we need to create something called a Frequency Table where we will create intervals of all the test scores, then tally each score given within the data set.
65, 65, 70, 72, 80, 95, 99, 92, 83, 78
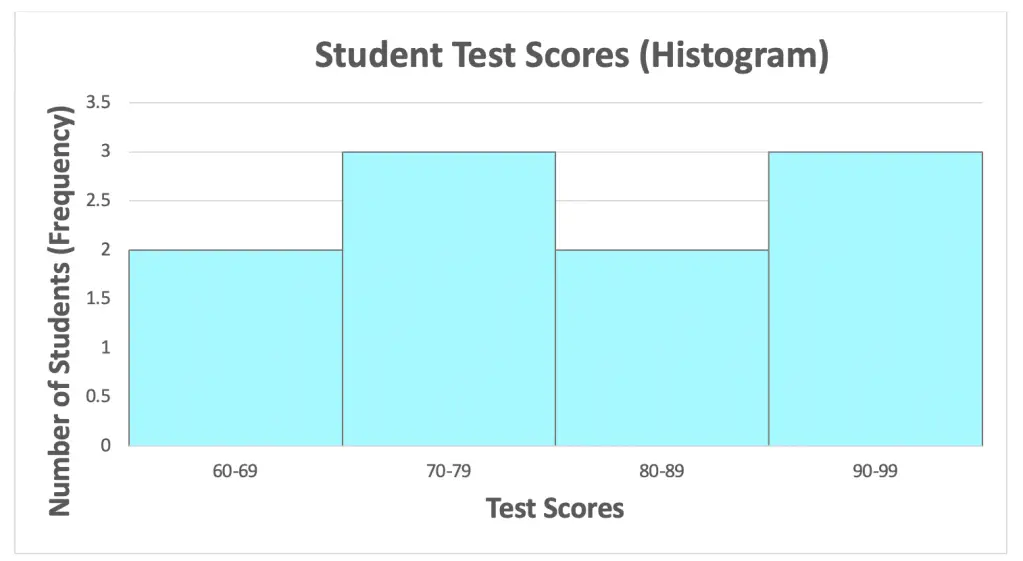
Step 2: Now we can start creating our graph with the frequency on the y-axis and the test score intervals on the x-axis. Noticed that we also gave the histogram a title.
When you’re ready, check out the questions below to practice your histogram skills!
Practice Questions:
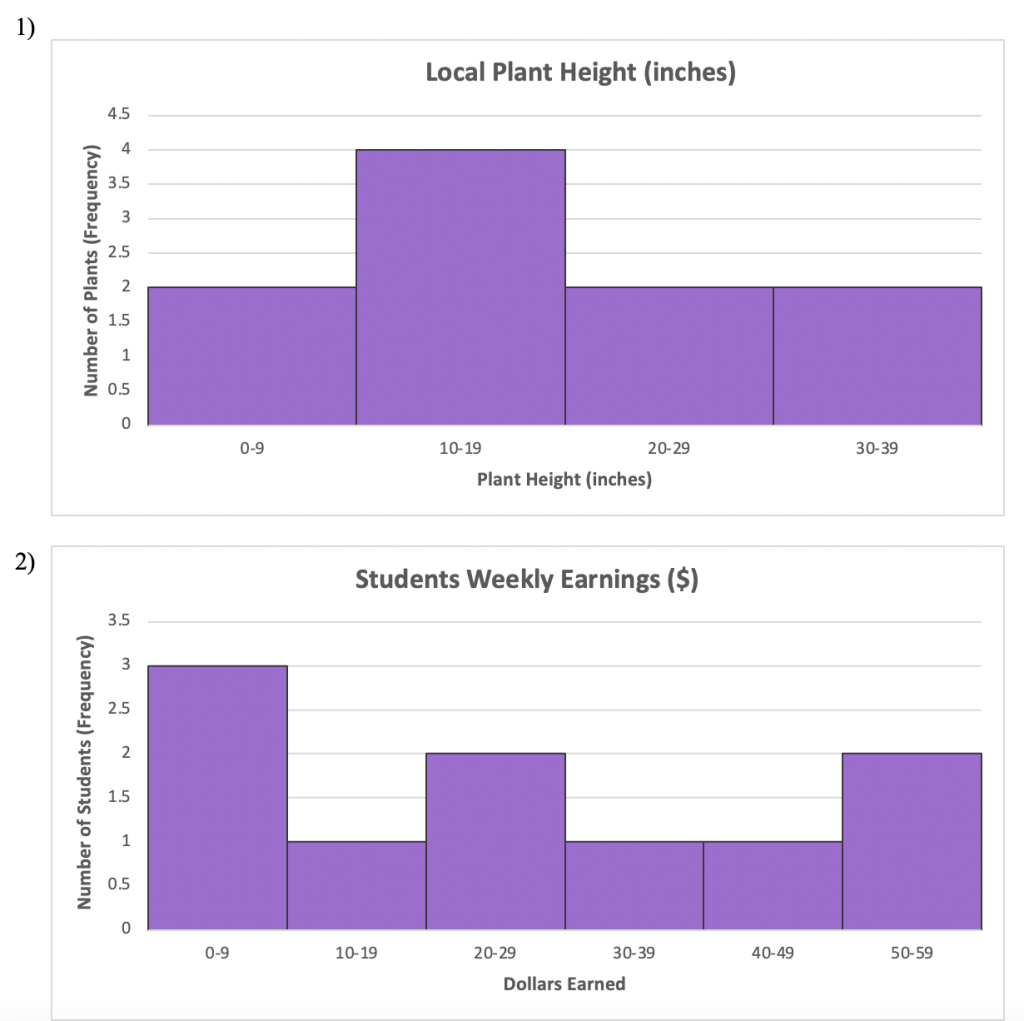
1) The science club is measuring the length of different local plants in inches and gather the following data. Create a histogram that represents their findings.
10, 12, 7, 24, 36, 8, 14, 24, 18, 30
2) A class survey is taken to find out how much students earn every week from small jobs and chores. Create a histogram for the following data that was collected:
$0, $0, $0, $15, $20, $50, $47, $25, $30, $52
Solutions:
Still got questions? No problem! Don’t hesitate to comment with any questions or check out the video above. Happy calculating! 🙂
Hi everyone and welcome to MathSux! In this post we are going to be constructing a perpendicular bisector by using a compass and stright edge. A perpendicular bisector, (also known as a segment bisector), is a line that cuts a line segment in half and creates four 90º angles. It is a super fast and super simple construction! We’ll also go over the Perpendicular Bisector Theorem we can infer from our original construction. If you’re looking for more geometric constructions, don’t forget to check more out here. Thanks so much for stopping by and happy calculating! 🙂
What is the Perpendicular Bisector of a line segment?
A perpendicular bisector slices our line segment AB (or any line segment) in half at its midpoint, creating two equal halves.
This will also create a 90º angle ( or right angle) about the line.
What is happening in this GIF?
Step 1: Notice we are given line segment AB. First, we are going to measure out a little more than halfway across the line segment AB by using a compass.
Step 2: Next we are going to place the point of the compass on point A and swing above and below line segment AB to create a half circle.
Step 3: Keeping the same distance on our compass, we are then going to place the point of the compass onto Point B (the opposite side) and repeat the same step we did on point A, drawing an arc in the shape of a semi-circle.
Step 4: Notice the intersection point above and below line segment AB!? Now, we are going to connect these two points by drawing a line with a ruler or straightedge.
Step 5: Yay! We now have a segment bisector! This cuts line segment AB right at its midpoint, while also dividing line segment AB into two equal halves and creating a 90º angle around our two intersecting lines.
Perpendicular Bisector Theorem:
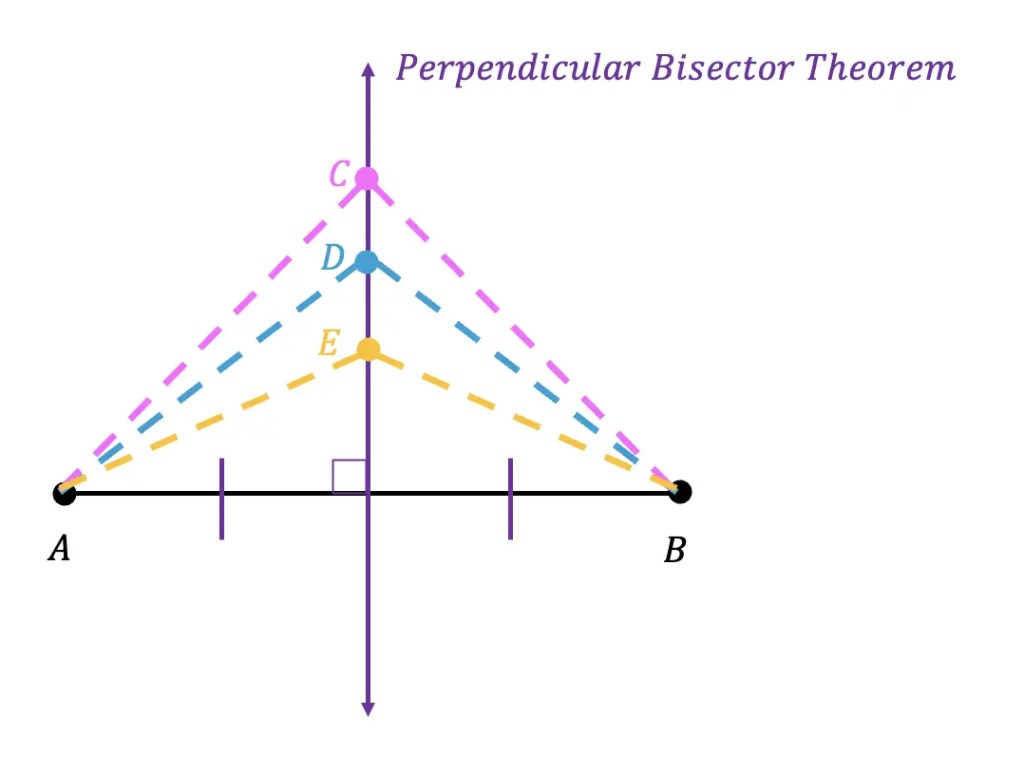
The Perpendicular Bisector Theorem explains that any point along the perpendicular bisector line we just create is equidistant to each end point of the original line segment (in this case line segment AB).
Therefore, if we were to draw points C,D, and E along the perpendicular bisector, then draw imaginary lines stemming from these points to each end point, we’d get something like the image below:
AC = CB
AD = DB
AE = EB
Notice that with each of our points on the perpendicular line above, we can now state that the following is true:
AC = CB
AD = DB
AE = EB
The fact that we can state the above is true is reason for the Perpendicular Bisector Theorem!
Constructions and Related Posts:
Looking to construct more than just a perpendicular segment bisector? Check out these related posts and step by step tutorials on geometry constructions below!
Looking to get the best construction tools? Any compass and straight edge will do the trick, but personally, I prefer to use my favorite mini math toolbox from Staedler. Stadler has a geometry math set that comes with a mini ruler, compass, protractor, and eraser in a nice travel-sized pack that is perfect for students on the go and for keeping everything organized….did I mention it’s only $7.99 on Amazon?! This is the same set I use for every construction video! Check out the link below and let me know what you think!
Still got questions? No problem! Don’t hesitate to comment with any questions below or check out the video above. Thanks for stopping by and happy calculating! 🙂
Want to see how to construct a square inscribed in a circle? Or maybe you want to construct an equilateral triangle? Click on each link to view each construction! And if you’re looking for even more geometry constructions, check out the link here! And if you’re looking for a construction you don’t yet see, please be sure to suggest it in the comments below!
Hi everyone and welcome to MathSux! In honor of school state tests being back on, I bring to you a playlist that goes over each and every question from the NYS Algebra Regents from January 2020. The entire playlist is 100% free of charge and fear not because there are more Regents review questions and playlists on the way! If you’re looking specifically for NYS Algebra Common Core Regents Review questions check out the links listed at the end of this post. Good luck on the Algebra Regents and happy calculating! 🙂
If you’re looking for a review on all of Algebra, don’t forget to check out the Algebra playlist on Youtube below. And if you’re wondering how to study math in the first place, don’t forget to check out this post here.
Hi everyone and happy Wednesday! Today we are going to look at how to solve inequalities with 2 variables. You may hear this in your class as “Simultaneous Inequalities” or “Systems of Inequalities,” all of these mean the same exact thing! The key to answering these types of questions, is to know how to graph inequalities and to know that the solution is always found where the two shaded regions overlap each other on the graph. We’re going to go over an example one step at time, then there will be practice questions at the end of this post that you can try on your own. Happy calculating! 🙂
How to Solve Inequalities with 2 Variables:
Just to review, when graphing linear inequalities, remember, we always want to treat the inequality as an equation of a line in form….with a few exceptions:
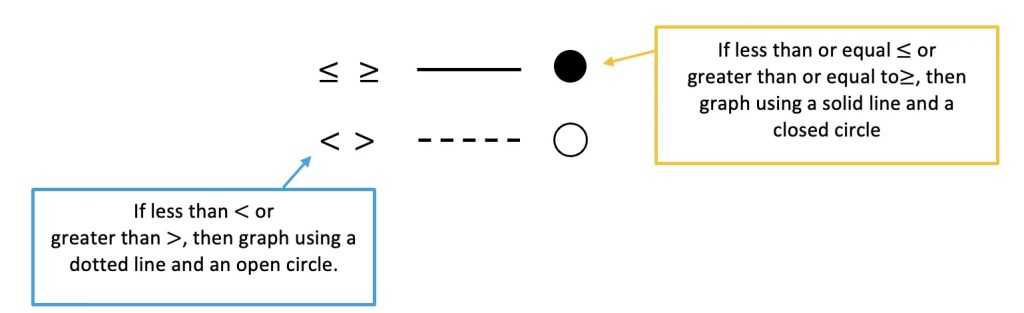
1)Depending on what type of inequality sign we are graphing, we will use either a dotted line and an open circle (< and >) or a solid line and a closed circle (> or <) and to correctly represent the solution.
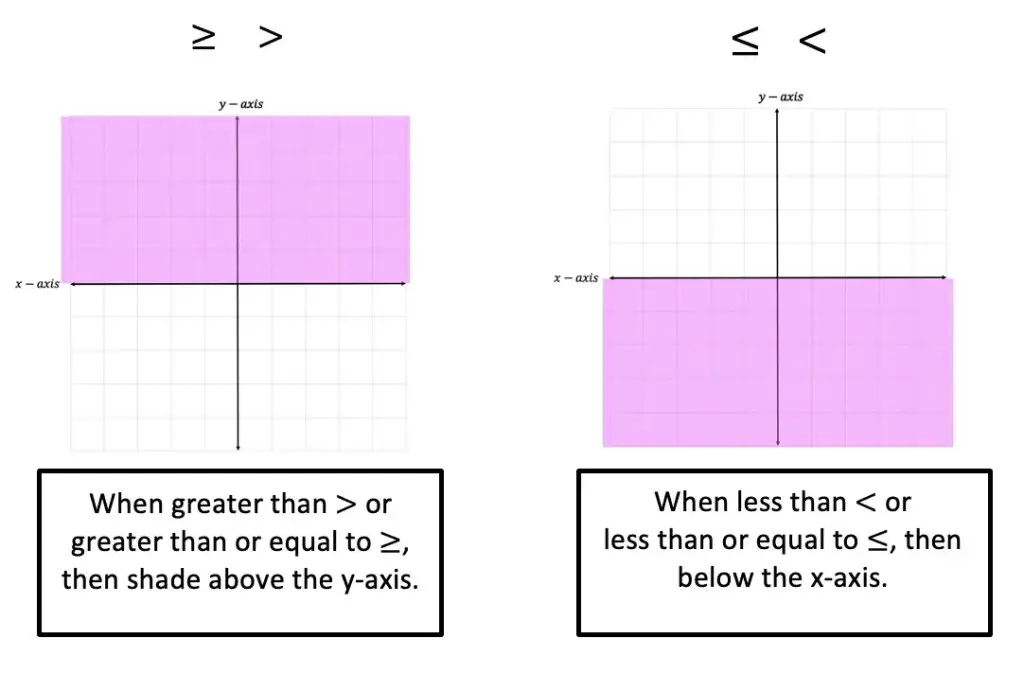
2) Shading is another important feature of graphing inequalities. Depending on the inequality sign we will need to either shade above the x-axis ( > or > ) or below the x-axis ( < or < ) to correctly represent the solution.
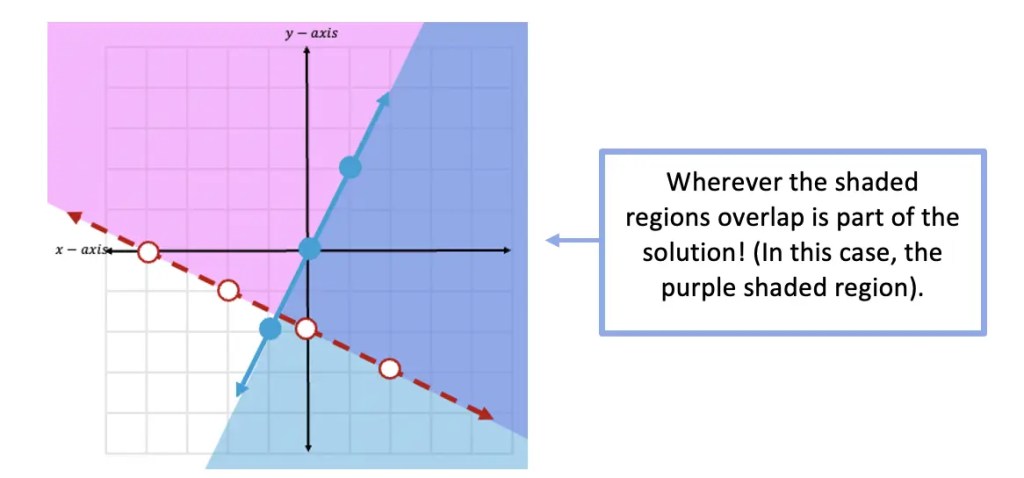
3) Solution: To find the solution of a system of inequalities, we are always going to look for where the shaded regions of both inequalities overlap.
Now that we know the rules, of graphing simultaneous inequalities, let’s take a look at an Example!
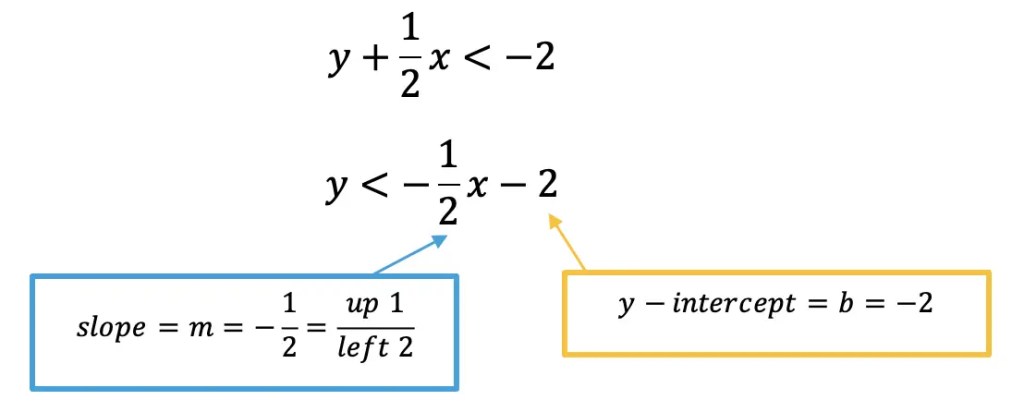
Step 1: First, let’s take our first inequality, and get it into y=mx+b form. To do this, we need to move .5x to the other side of the inequality by subtracting it from both sides. Once we do that, we can identify the slope and the y-intercept.
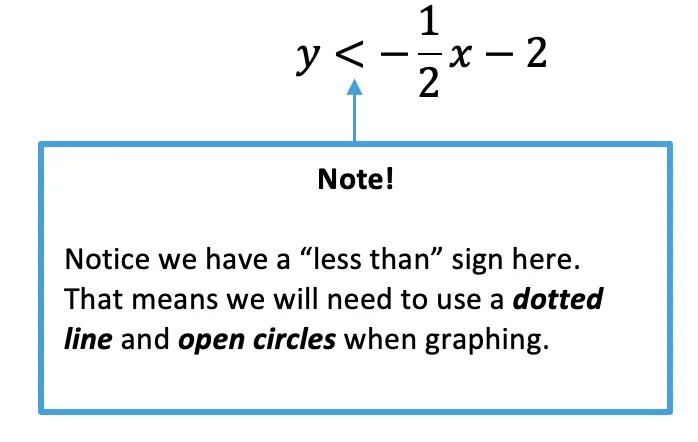
Step 2: Before graphing, let’s now identify what type of inequality we have here. Since we are working with a < sign, we will need to use a dotted lineand open circles when graphing.
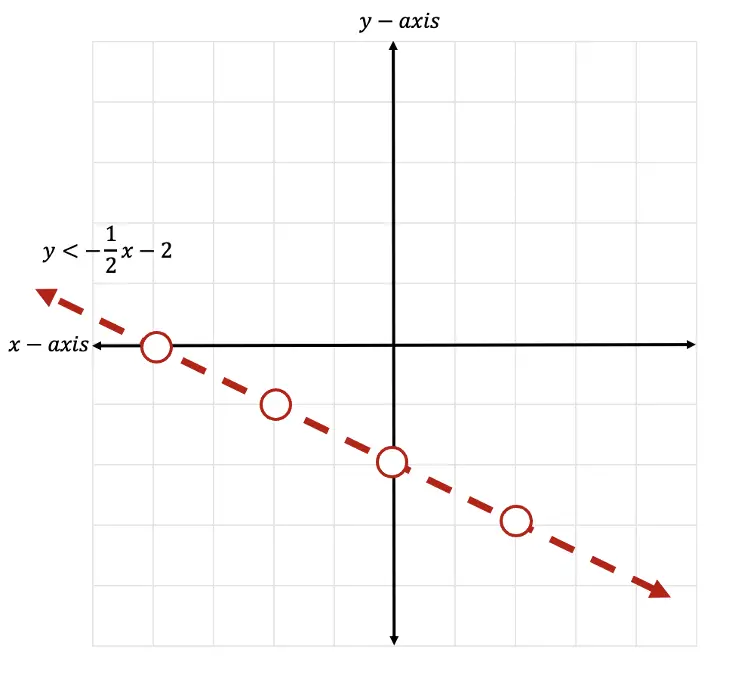
Step 3: Now that we have identified all the information we need to, let’s graph the first inequality below:
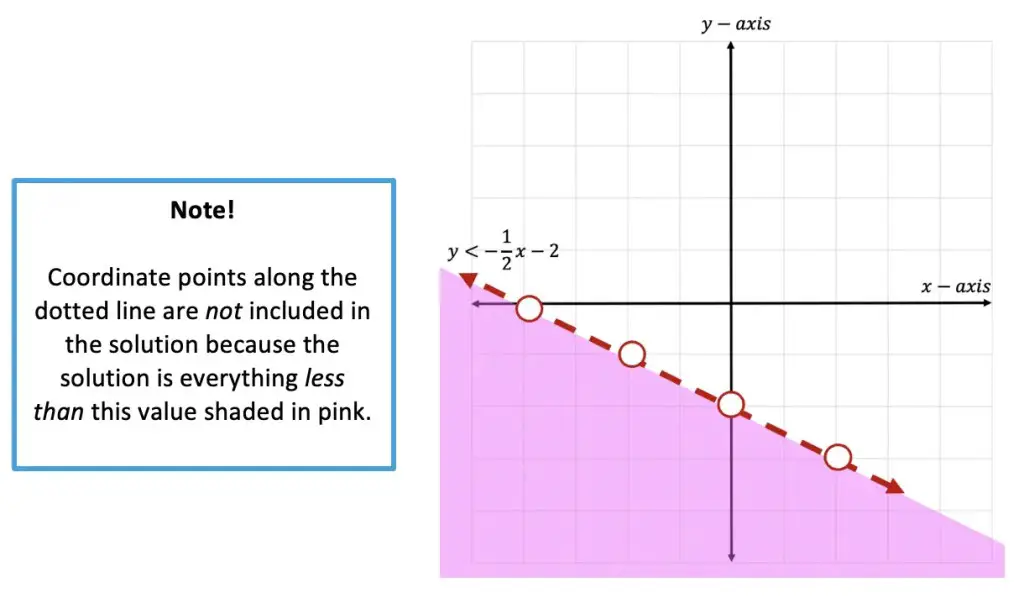
Step 4: Now it is time for us to shade our graph, since this is an inequality, we need to show all of our potential solutions with shading. Since we have a less than sign, <, we will be shading below the x-axis. Notice all the negative y-values below are included to the left of our line. This is where we will shade.
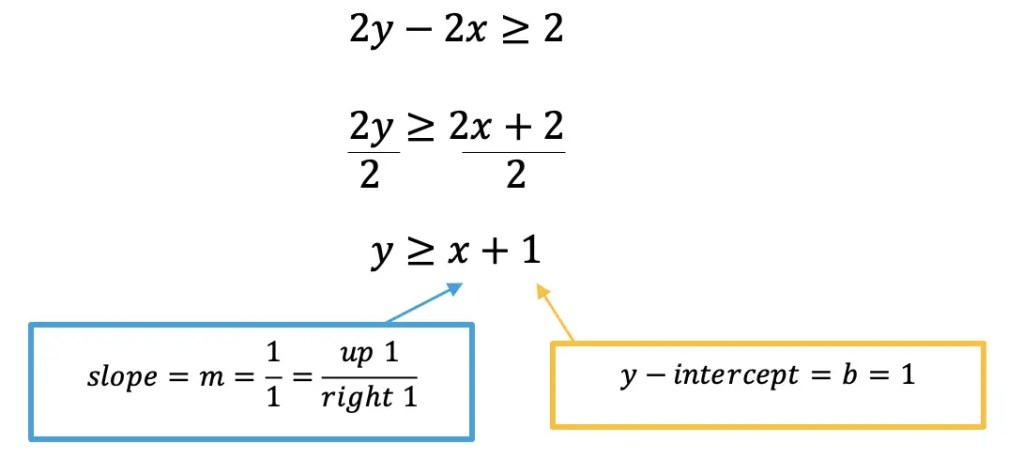
Step 5: Next, let’s start graphing our second inequality! We do this by taking the second equation, and getting it into y=mx+b form. To do this, we need to move 2x to the other side of the inequality by adding it to both sides. Then we can simplify the inequality even further by dividing out a 2.
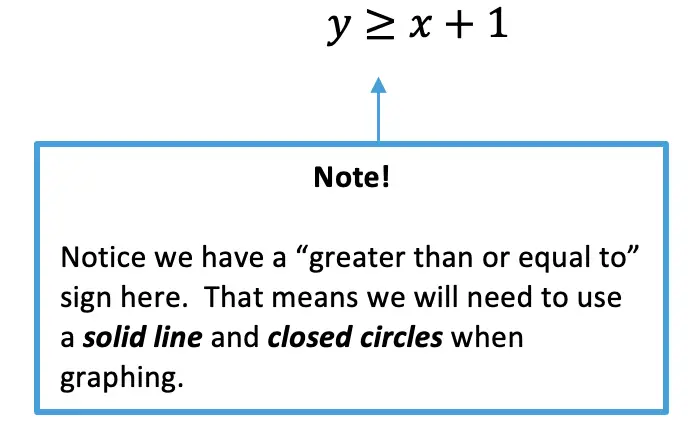
Step 6: Before graphing, let’s now identify what type of inequality we have here. Since we are working with a > sign, we will need to use a solid lineand closed circles when creating our graph.
Step 7: Now that we have identified all the information we need to, let’s graph the second inequality below:
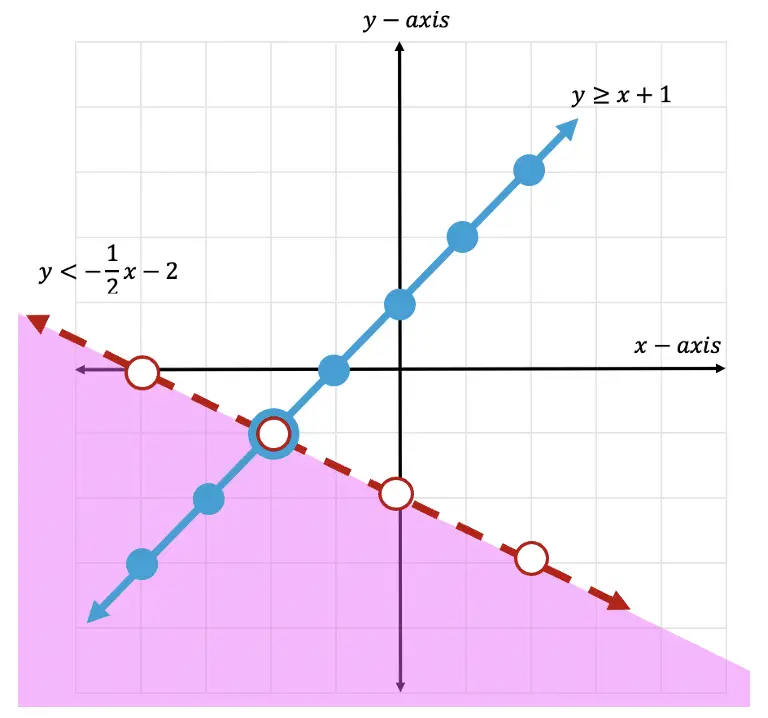
Step 8: Now it is time for us to shade our graph. Since we have a greater than or equal to sign, >, we will be shading above the x-axis. Notice all the positive y-values above are included to the left of our line. This is where we will shade.
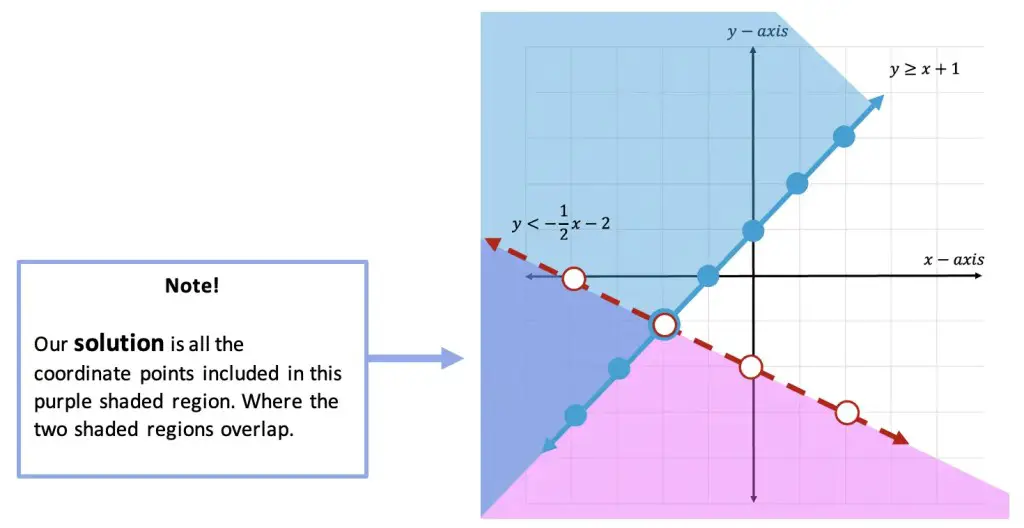
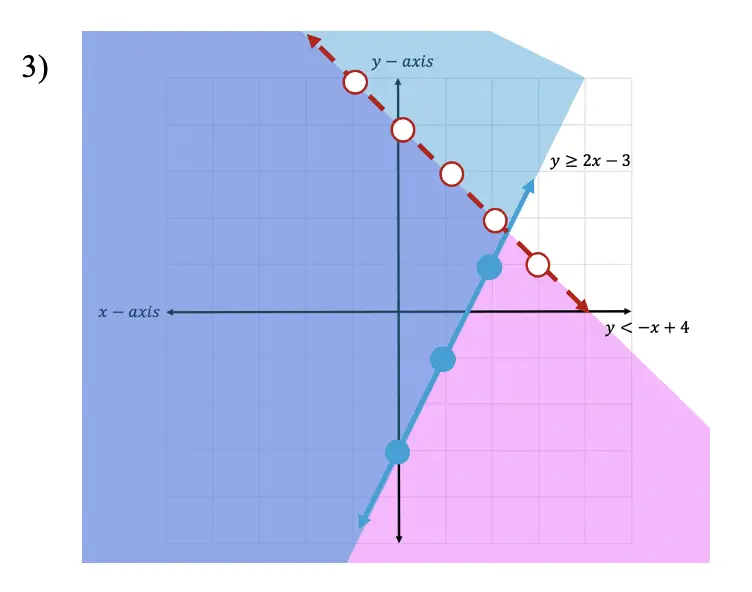
Where is the solution?!
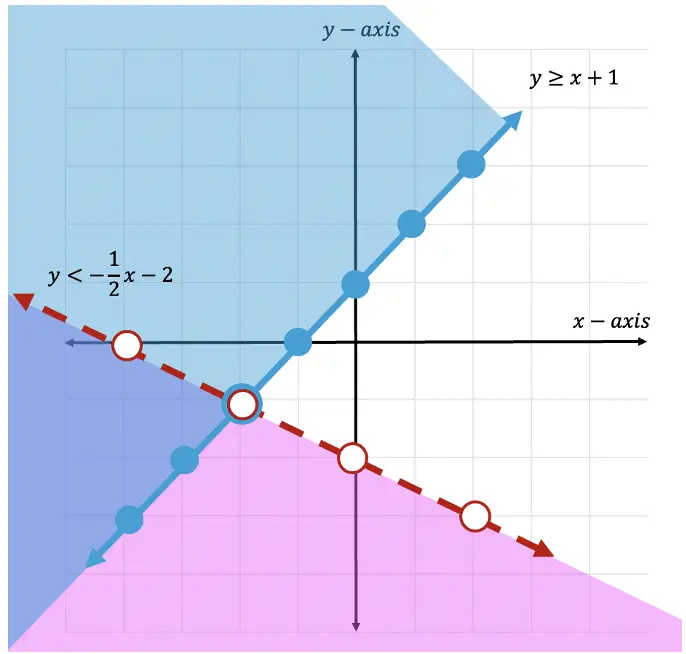
Step 9: The solution is found where the two shaded regions overlap. In this case, we can see that the two shaded regions overlap in the purple section of this graph.
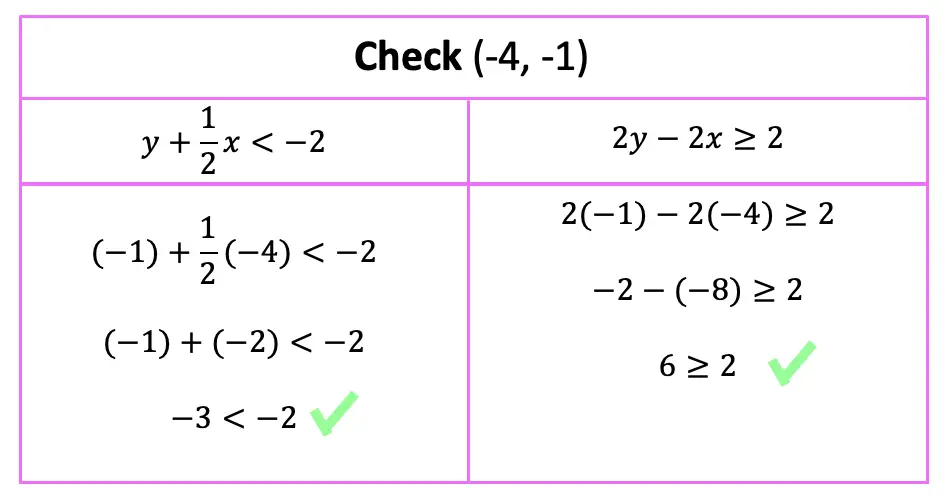
Step 10: Check! Now we can finally check our work. To do that, we can choose any point within our overlapping purple shaded region, if the coordinate point we choose holds true when plugged into both of our inequalities then our graph is correct!
Let’s take the point (-4,-1) and plug it into both original inequalities where x=-4 and y=-1.
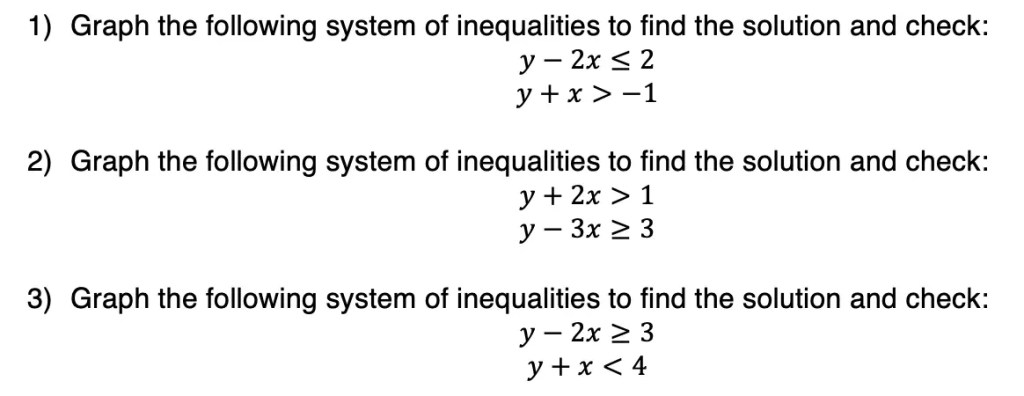
Practice Questions:
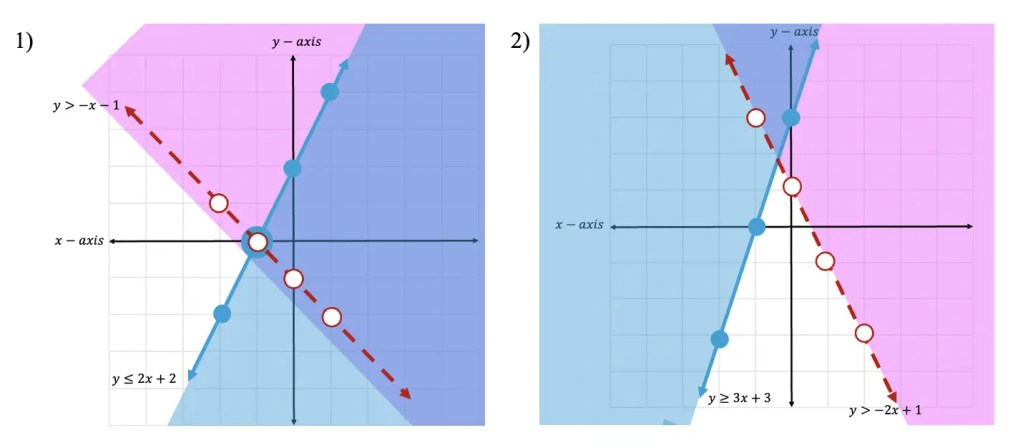
Solutions:
Still got questions? No problem! Don’t hesitate to comment with any questions below. Thanks for stopping by and happy calculating! 🙂
Ahoy math friends and welcome to MathSux! In this post, we are going to go over the inscribed angle theorem which dives into inscribed angles and intercepted arcs. We’ll break down the main basic rule for inscribed angle theorem and the three inscribed angle theorems associated with this rule. If you are looking for more circle theorems, check out these posts on the Intersecting Secants Theorem and Central Angles Theorem. Also, don’t forget to check out the video and practice questions to truly master the topic below. Happy calculating! 🙂
Inscribed Angles:
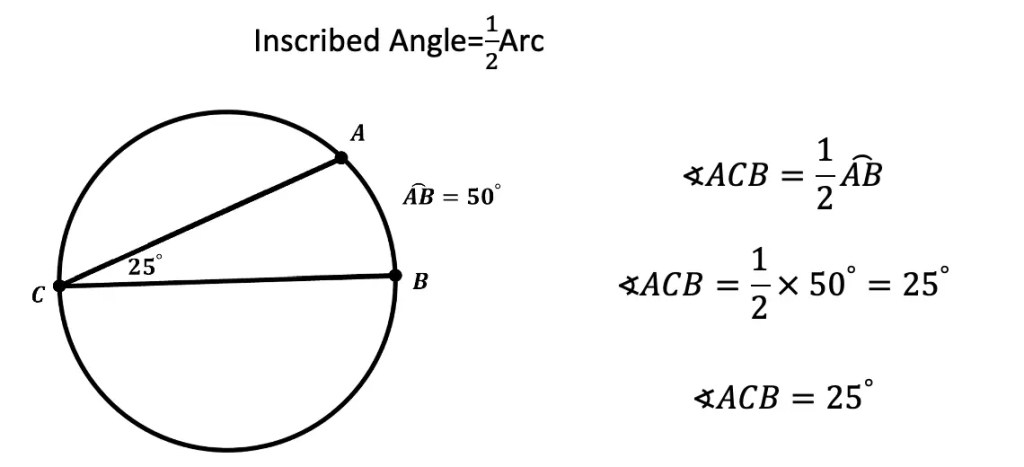
When two chords come together to touch the outline of a circle, they create something called an inscribed angle. Unlike central angles, an inscribed angle is equal to half the measure of the arc length. In the example below, we can see that the inscribed angle ACB is equal to 25º while its corresponding intercepted arc AB is twice the inscribed angle at 50º. Knowing this allows us to find the value of unknown arcs or inscribed angles.
Inscribed Angle Theorem:
There are three parts to the inscribed angle theorem to know based on the rule stated above, check them out below!
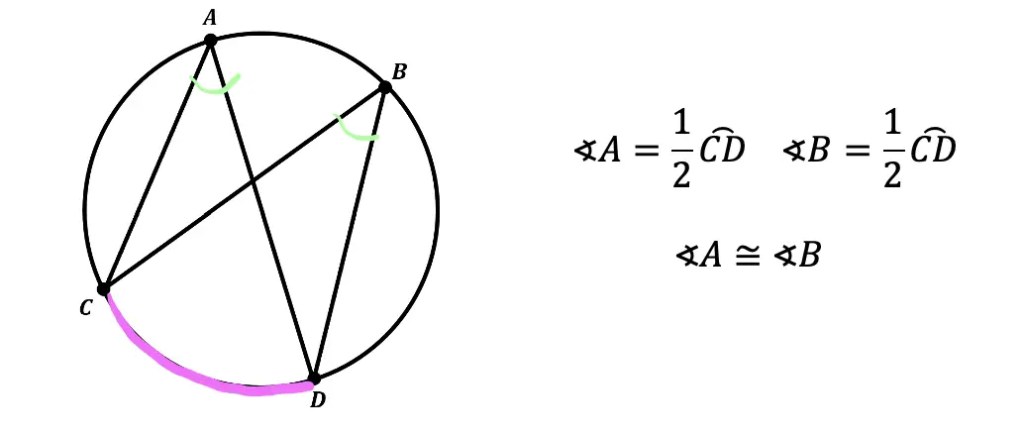
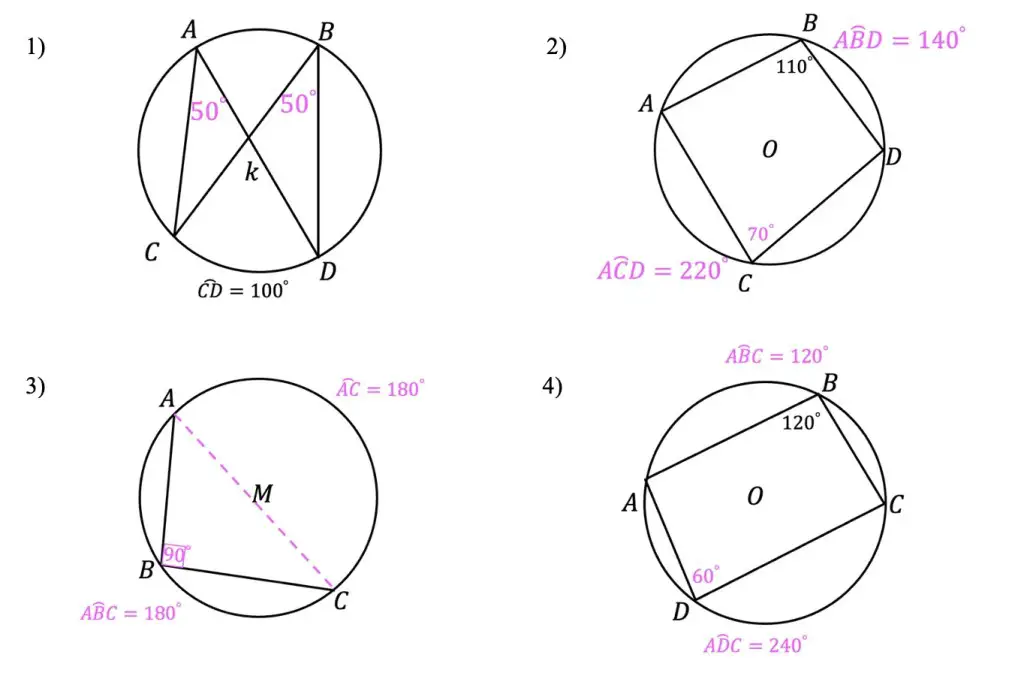
The inscribed angle theorem states that, in a circle when two inscribed angles intercept the same arc, the angles are congruent. Notice below how angle A and angle B both have the same arc CD (hi-lighted in pink). In this theorem, we have two inscribed angles, angle A and angle B, that intercept the same arc, arc CD.
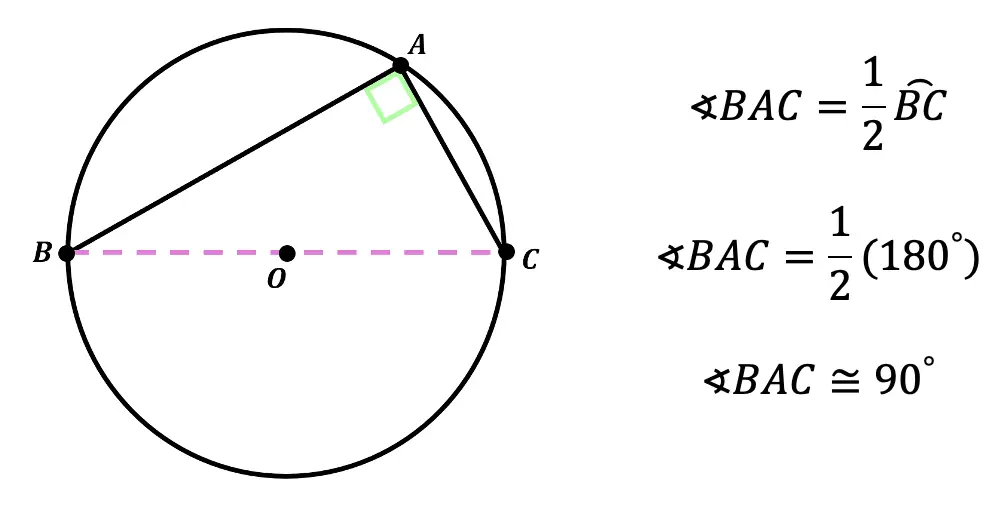
Theorem #2: In a circle when an angle is inscribed by a semicircle, it forms a 90º angle (or a right angle). If you look at angle BAC below, you’ll notice that the arc it corresponds with is a semicircle and that angle BAC forms a right angle.
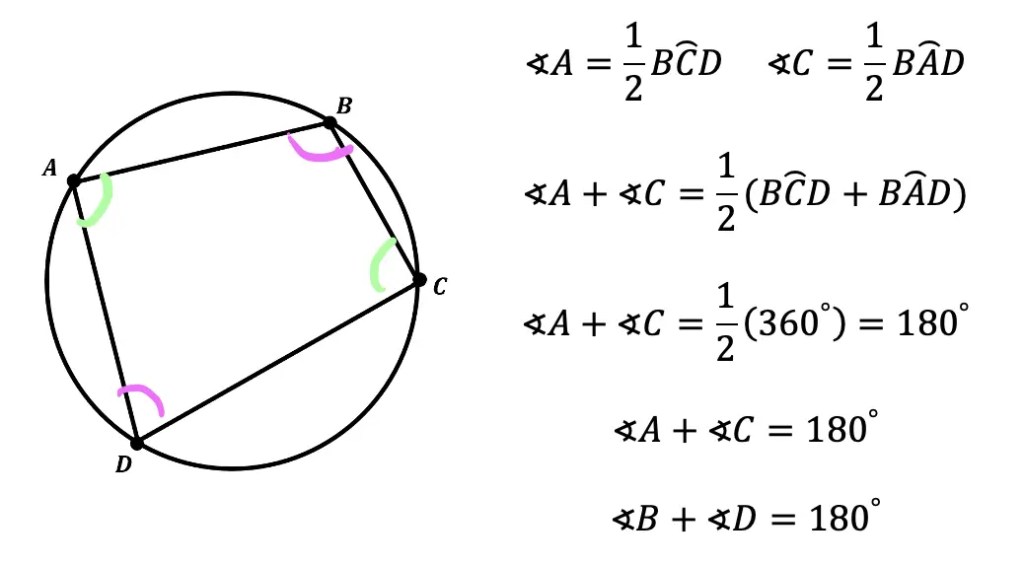
Theorem #3: When a quadrilateral is inscribed within a circle, the opposite angles formed are supplementary, meaning that they add to 180º. The proof below shows angles A and C (hi-lighted in green) as supplementary, but this proof would also work for opposite angles B and D (hi-lighted in pink).
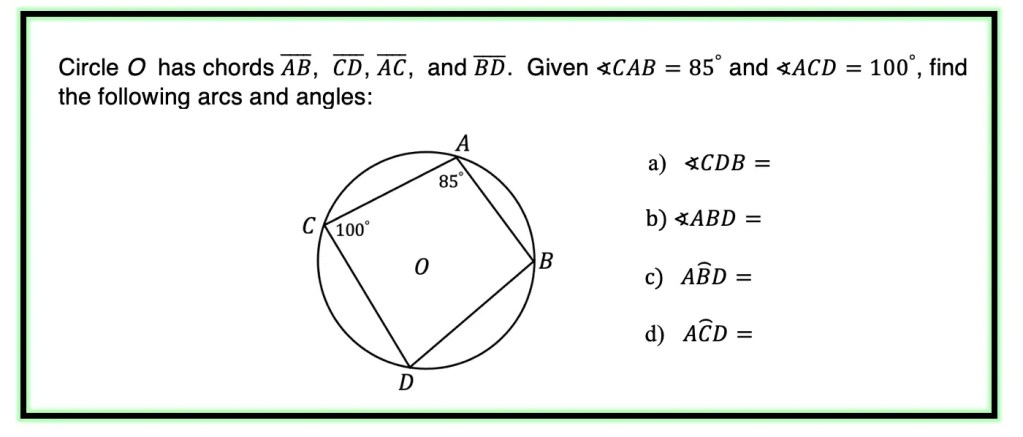
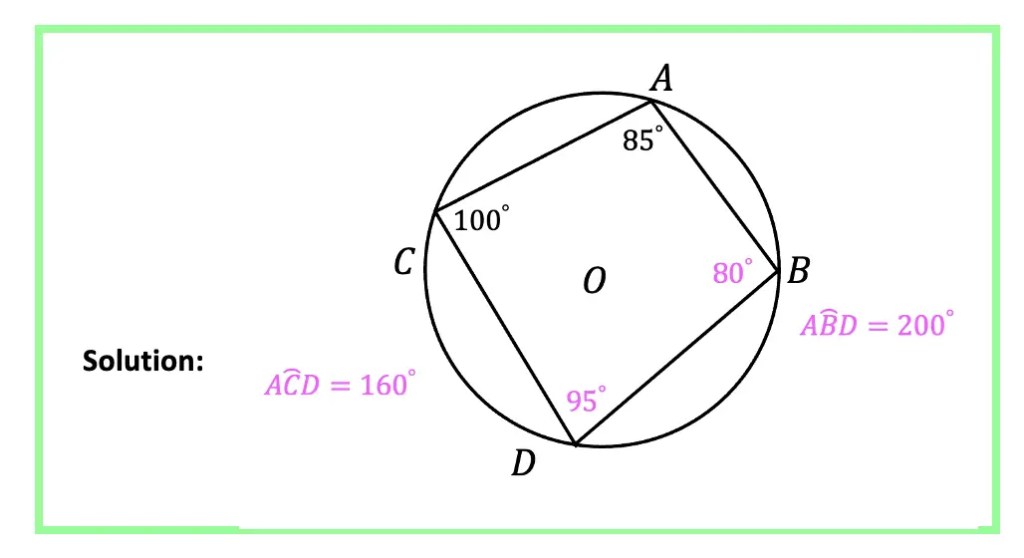
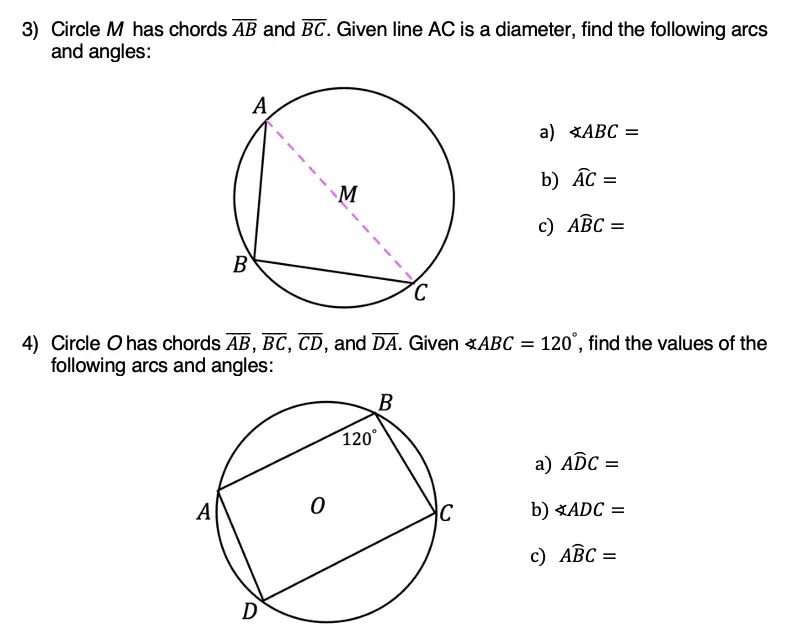
Let’s look at how to apply these rules with an Example:
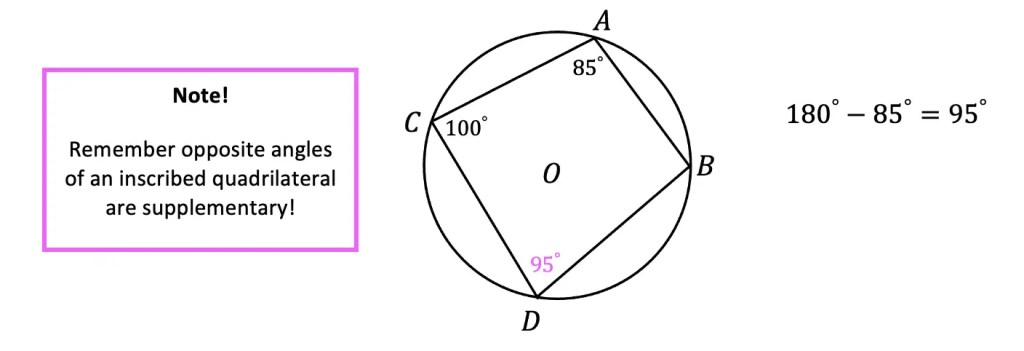
a) Step 1: To find the value of angle CDB we need to look at our given information. We know that angle CAB=85º, notice that this follows theorem number 3, “When a quadrilateral is inscribed in a circle, opposite angles are supplementary.” Therefore, we must subtract 110º from 180º to find the value of angle CDB.
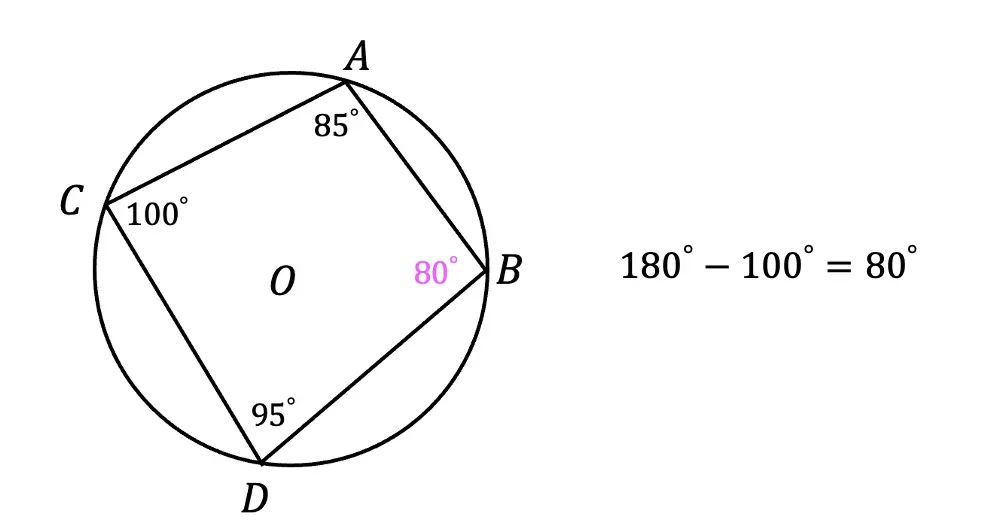
b) Step 2: For finding angle ABD, we’re going to use the same theorem we used in part a, opposite supplementary angles of an inscribed quadrilateral are supplementary.
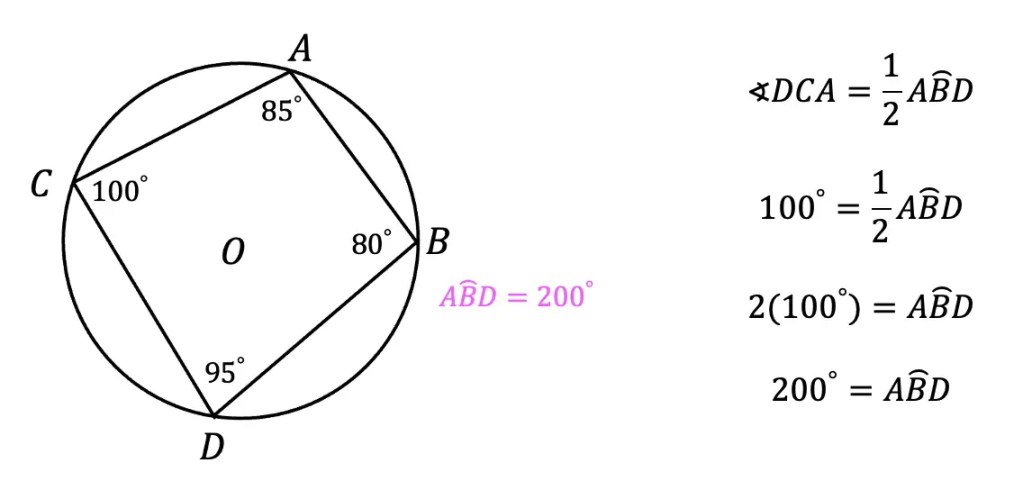
c) Step 3: Next, to find the value of arc ABD, we need to use the basic inscribed angle theorem that tells us an inscribed angle is equal to half the measure of its arc. Then use some basic algebra to solve for arc ABD.
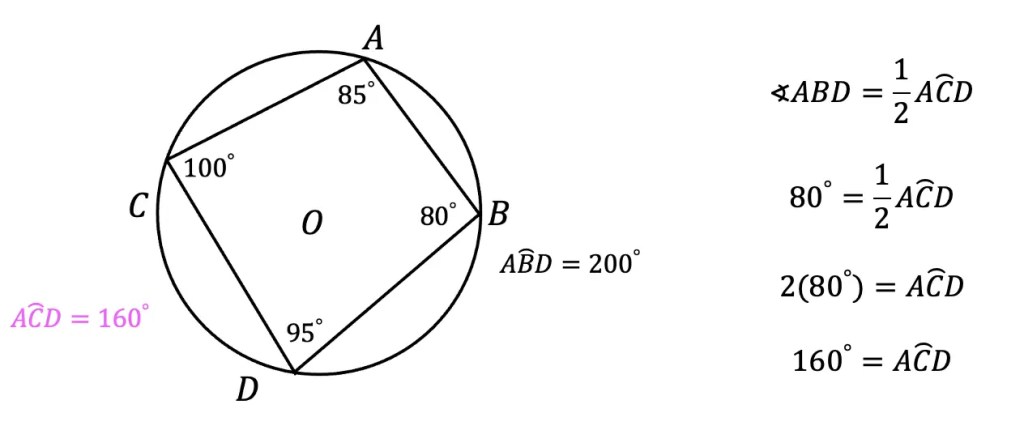
d) Step 4: To find arc ACD, we need to use the basic inscribed angle theorem that tells us an inscribed angle is equal to the value of its arc, then use algebra to solve similar to part c.
If this looks confusing, check out the video above! And when you are ready master this topic with the practice questions below!
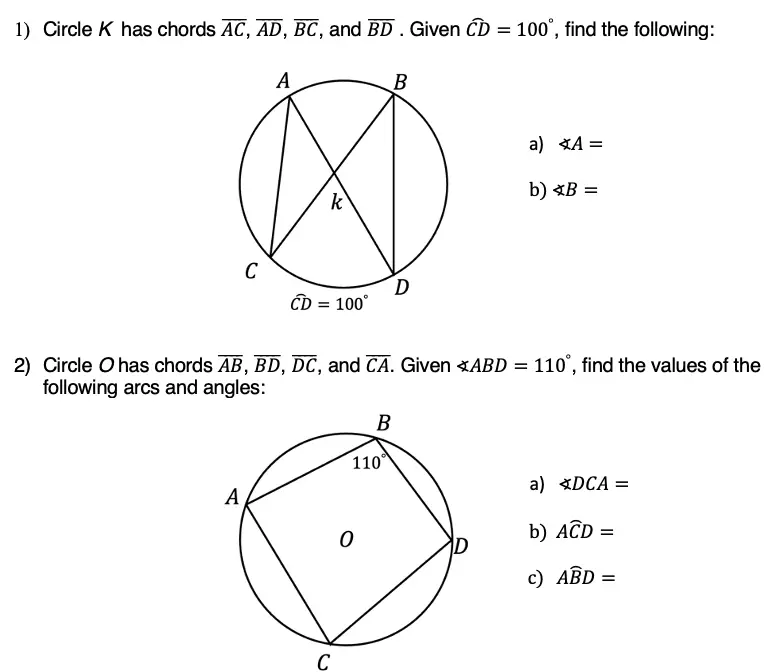
Practice Questions:
Use the inscribed angle theorem outlined above to answer the following questions.
Solutions:
Still got questions? No problem! Check out the video above or comment below for any questions and follow for the latest MathSux posts. Happy calculating! 🙂
Hi everyone and welcome to MathSux! In this post we are going to go over summation notation (aka sigma notation). The summing of a series isn’t hard as long as you know how to read the notation! We will go over an example and breakdown what each part of this notation represents step by step. When you are ready, please don’t forget to check out the practice questions at the end of this post to truly master the topic. Thanks for stopping by and happy calculating! 🙂
What is Summation Notation?
Summationnotation lets us write a series in an easy and short-handed way. Before we go any further we also need to define a series!
Series: The sum of adding each term within an infinite sequence. This can include arithmetic or geometric sequences we are already familiar with. For example, let’s say we have the arithmetic sequence: 2,4,6,8, ….. now with a series we are adding all of these terms together: 2+4+6+8+……
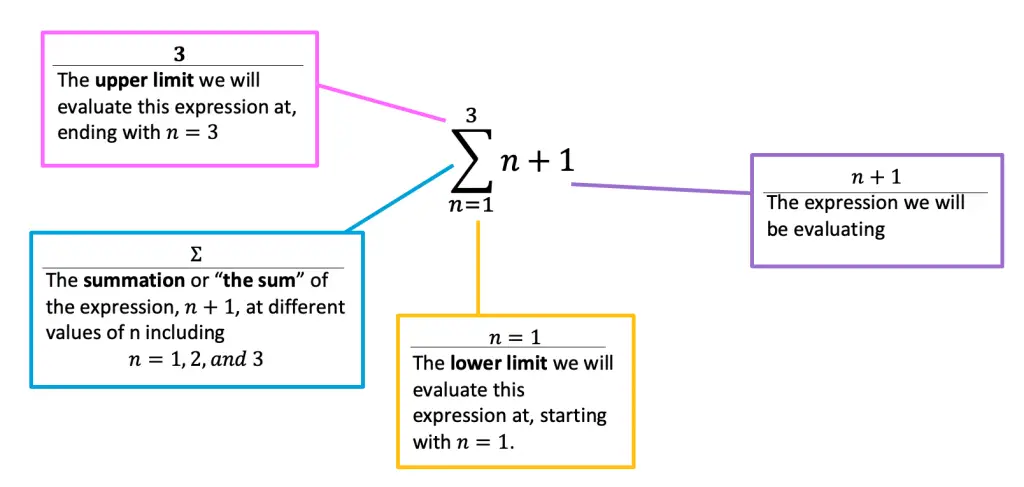
Now back to summations. Summations allow us to quickly understand that the sequence being added together is done so on an infinite or finite basis by giving us a range of values for which the unknown variable can be evaluated and summed together. Summation notation is represented with the capital Greek letter sigma, Σ, with numbers below and above as limits for calculation and the series that must be evaluated to the right.
If this sounds confusing, don’t worry, it might sound more confusing than it actually is! Take a look at the breakdown for sigma notation below:
Wait, what does the above summation say?
Translation: It tells us to evaluate the expression, n+1 by plugging in 1 for n, 2 for n, and 3 for n and then wants us to sum all three solutions together.
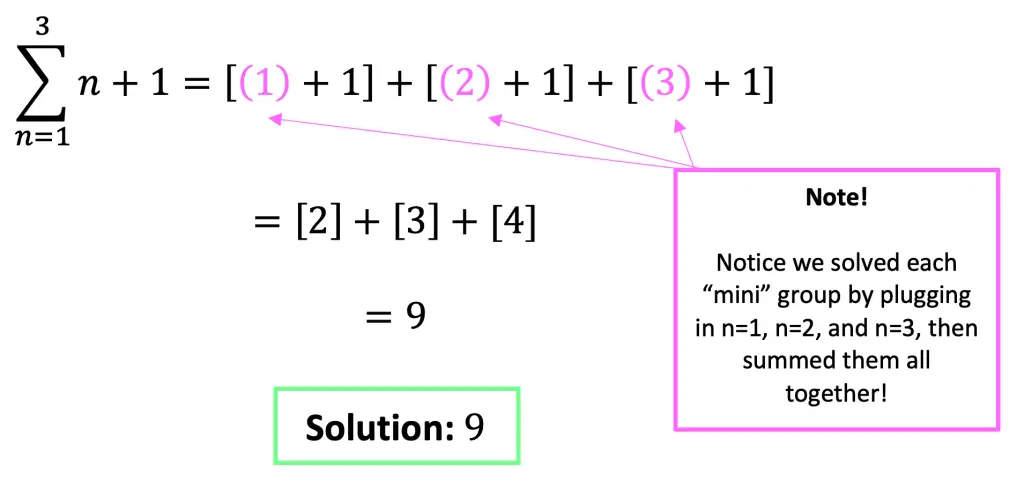
Take a look below to see how to solve this step by step:
Check out the video above to see more examples step by step! When you’re ready to try them on your own, check out the practice problems below:
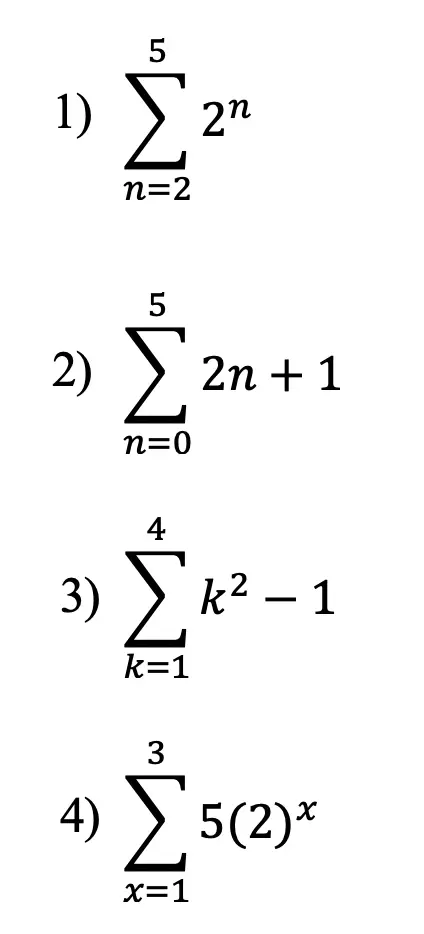
Practice Questions:
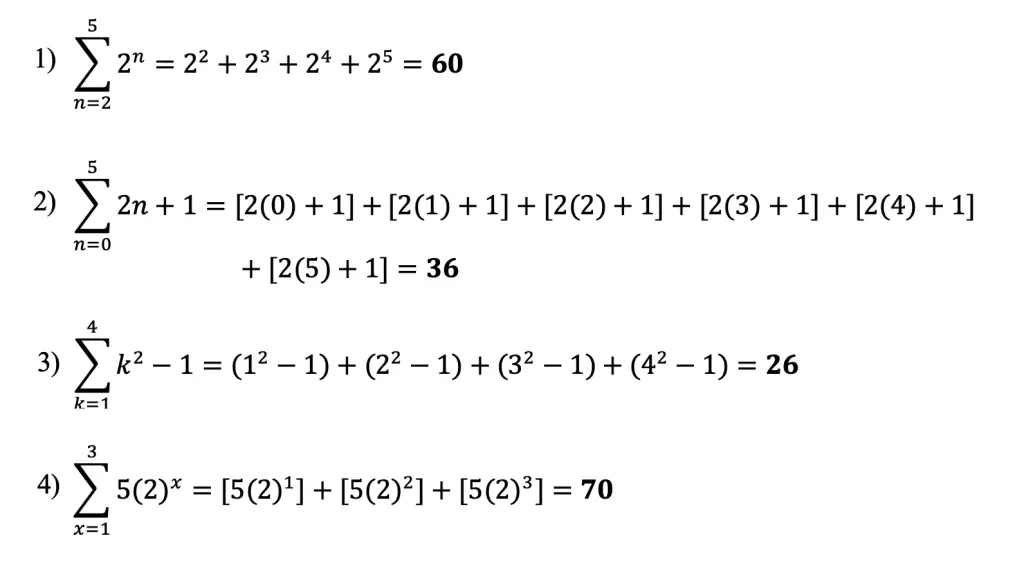
Solutions:
Still got questions? No problem! Don’t hesitate to comment with any questions below. Thanks for stopping by and happy calculating! 🙂
Looking for something similar to sigma notation? Check out this post on geometric sequences here! If you’re looking for more statistics formulas, check out how to find expected value!
Hi everyone and welcome to MathSux! In this post, we are going to go over the continuously compounding interest formula, A=Pert! This is a great topic as it relates to finance and real-world money situations (sort of). We are going to break down everything step by step by understanding what the continuously compounding interest rate formula A=Pert is, identifying each component of the formula, and then applying it to an example. If you’re looking for more, don’t forget to check out the video and the practice questions at the end of this post. Happy calculating! 🙂
What is Continuous Compounding Interest Formula?
Let’s say we have $500 and we want to invest it.
What if it compounded interest once a year?
Twice a year?
Once a day, or 365 days a year?
What if we compounded interest every second of the day for a total of 86,400 seconds throughout the year!?
And what if we kept going, making the number of times compounded annually more and more often to occur every half second? This is what Continuous Compounding Interest is, and it tells us how much we earn on a principle (original amount) if the compound interest rate for the year were to be granted an infinite number of times.
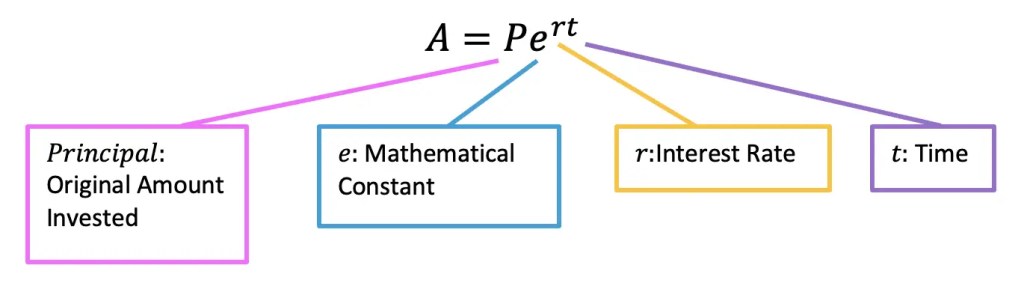
The weird thing is that continuous compounding interest is technically impossible (I’ve yet to see a bank that offers an infinite number of compounding interest!). Even though it is impossible, in math and finance, we look at continuous compounding interest for theoretical purposes, in other words, it’s for money nerds! Luckily, it comes with an easy-to-use formula, let’s take a look:
Now, let’s see this formula in action with the following Example:
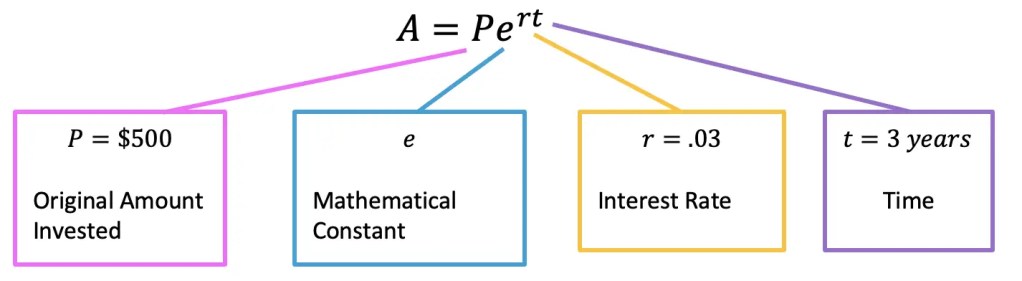
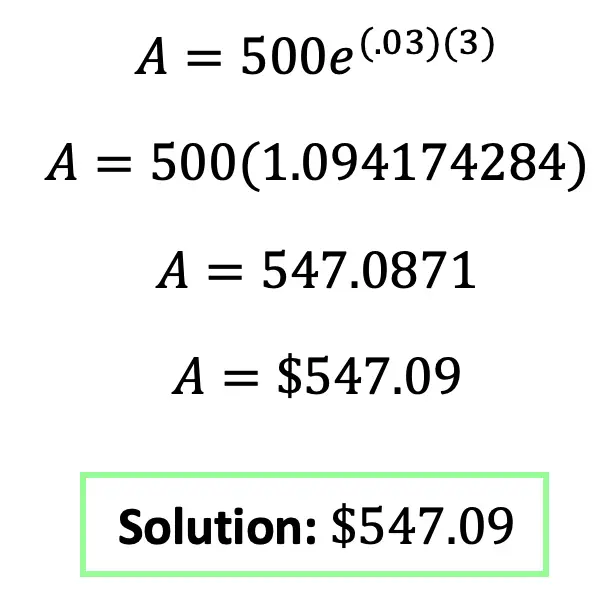
Step 1: First, let’s write out our formula and identify what each value represents based on the question.
Step 2: Fill in our formula with the given values and solve.
Practice Questions:
1) Sally invested $1000 which was then continuously compounded by 4%. How much money will Sally have after 5 years?
2) Brad invested $1500 into an account continuously compounded by 5%. How much money will he have after 7 years?
3) Fran invests $2000 into an account that is continuously compounded by 1%. How much money will Fran earn by year 5?
Solutions:
1) $1,221.40
2) $2,128.60
3) $2,102.54
Want to make math suck just a little bit less? Subscribe to my Youtube channel for free math videos every week! 🙂
Greeting math friends and welcome to MathSux! In today’s post we are going to review and take a look at how to use the graphing calculator available by the French company, NumWorks.
In this NumWorks calculator review, first impressions are that this is a serious competitor for Texas Instruments and offers more features than a typical calculator with a focus on statistics, data analysis, and even computer programming! Check out the video below to see the un-boxing, full review, and how to use this calculator step by step. Happy calculating! 🙂
NumWorks Calculator Stand Out Features:
1) TheHome Screen: Works and looks like apps on an iPhone. It is super easy to use, and includes apps such as the regular graphing calculator we’re all used to, as well as, Python, Statistics, Probability, Equation Solver, Sequences, and Regression.
2) The Equation Solver: Punch in any function and find it’s x-values and discriminant! Very cool!
3) Python: Yes, this calculator is programmable via Python! It also includes pre-made scripts that you can easily run. This is great for aspiring programmers and important for today’s economy.
4) Exam Mode: Teachers can make students put their calculators in exam mode and watch their students calculators light up in red to prove there’s no cheating funny business going on! Warning though, this will delete all of your data including the pre-made Python scripts. But you can always hit the reset button in the back to reset.
Did I mention math teacher’s can potentially get a free calculator from NumWorks? Check out the link here!
Has anyone else tried this graphing calculator from NumWorks? What were your first thoughts? Let me know in the comments and happy calculating!